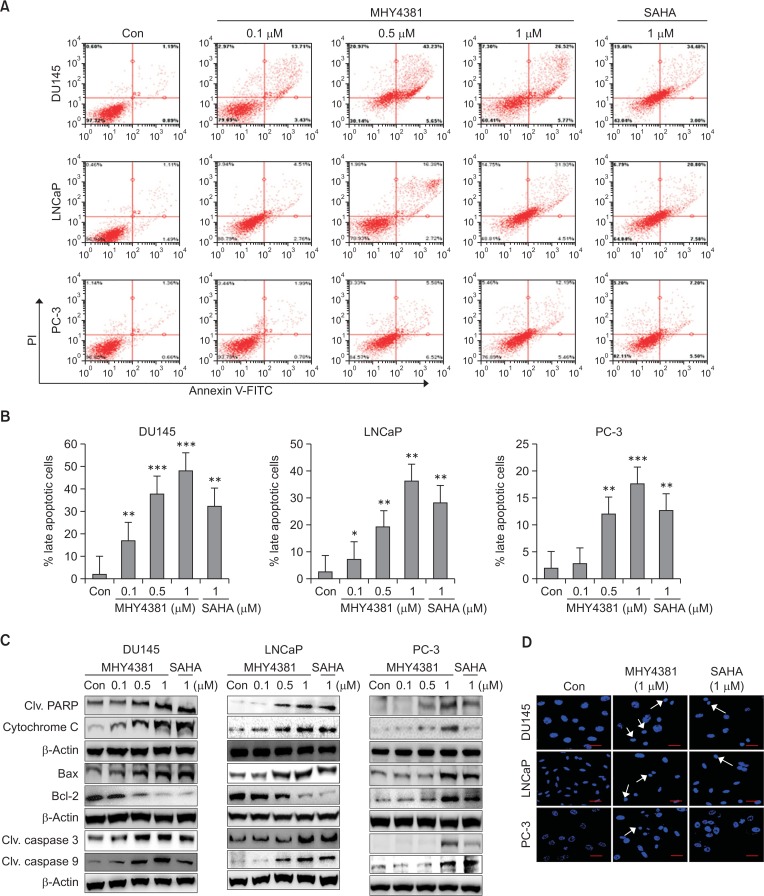
Fig. 4.
Apoptosis induced by MHY4381 and SAHA in DU145, LNCaP, and PC-3 prostate cancer cells. (A) Cells were treated with vehicle control, MHY4381 (0.1, 0.5, or 1 μM), or SAHA (1 μM) for 48 h, then stained with FITC-conjugated Annexin V and propidium iodide (PI) for flow cytometry analysis. The flow cytometry profile represents AnnexinV-FITC staining on the x axis and PI staining on the y axis. (B) Bar graph showing the percentage of late apoptotic cells. Data are expressed as mean ± SD. *p<0.05, **p<0.01, and ***p<0.001 versus the control group of three independent experiments. (C) Cells were treated with vehicle control, MHY4381 (0.1, 0.5, or 1 μM), or SAHA (1 μM) for 48 h and the expression of apoptosis-related proteins was analyzed by western blot. β-Actin was used as a loading control. (D) Effects of MHY4381 or SAHA on nuclear morphological changes assessed by DAPI staining. DU145, LNCaP, and PC-3 cells were treated with MHY4381 (1 μM) or SAHA (1 μM) for 48 h, followed by fixation and DAPI staining. Images were observed using an Olympus confocal microscope (FV10i. Magnification ×400, Olympus). Scale bar, 50 μm.

