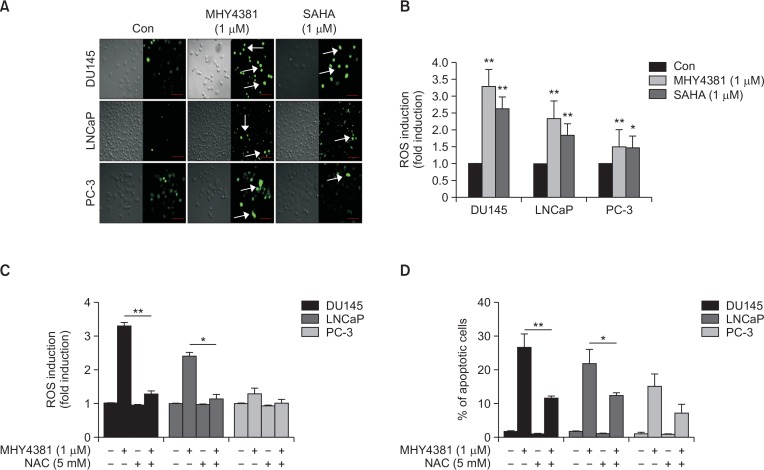
Fig. 5.
MHY4381 and SAHA induce generation of ROS in prostate cancer cells. (A) DU145, LNCaP, and PC-3 cells were treated with the indicated concentrations of MHY4381 and SAHA for 12 h and then stained with DCFH-DA (10 μM) for 30 min. Images were obtained using an Olympus confocal microscope (FV10i. Magnification ×400, Olympus). Scale bar, 50 μm. (B) Cells were treated with the indicated concentrations of MHY4381 and SAHA for 12 h and, stained with DCFH-DA (10 μM) and absorbance was read using a fluorometric imaging plate reader. Bar graph showing the ROS levels. Data are expressed as mean ± SD. *p<0.05, **p<0.01 versus control group for three independent experiments. (C) Bar graph showing the ROS level in cells after exposure to MHY4381 (1 μM), NAC (5 mM), or MHY4381 (1 μM) plus NAC (5 mM). *p<0.05, **p<0.01 versus MHY4381. (D) Apoptosis induced by ROS generation observed by flow cytometry. After exposure to MHY4381 (1 μM), NAC (5 mM), or MHY4381 (1 μM) plus NAC (5 mM) for 12 h, the apoptotic cells were observed by flow cytometry and depicted in a bar graph. The data are expressed as mean ± SD. *p<0.05, **p<0.01 versus MHY4381.

