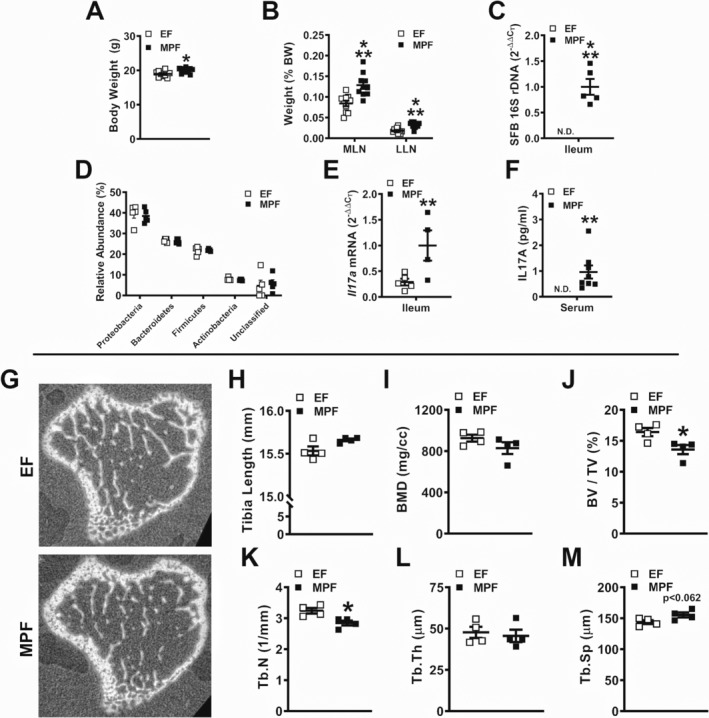
Figure 3.

Murine phenotype and trabecular bone analysis of excluded‐flora versus murine‐pathogen‐free mice. (A) Animal weight and (B) mesenteric lymph node and liver lymph node weights per body weight (n = 10/gp). (C) 16S rDNA gene analysis for segmented filamentous bacteria colonization in the distal ileum. Relative quantification of rDNA was performed via the comparative C T method (2‐ΔΔCT) (n = 5/gp). (D) Phylum‐level analysis of bacterial rDNA in the distal ileum, analysis represented as % relative abundance (n = 5/gp). (E) RNA was isolated from ileums (n = 5/gp) for qRT‐PCR analysis of Il17a mRNA. Relative quantification of mRNA was performed via 2−ΔΔCT. (F) Serum was isolated from whole blood (n = 7 to 8/gp); ELISA analysis of IL17A levels. (G–M) Micro‐CT analysis of proximal tibia trabecular bone (n = 4/gp). (G) Representative reconstructed cross‐sectional images, extending 50 μm distally from where analysis was initiated. (H) Tibia length. (I) BMD = trabecular bone mineral density. (J) BV/TV = trabecular bone volume fraction. (K) Tb.N = trabecular number. (L) Tb.Th = trabecular thickness. (M) Tb.Sp = trabecular separation. Unpaired t test; data are presented as mean ± SEM, *p < 0.050, **p < 0.010, ***p < 0.001.
