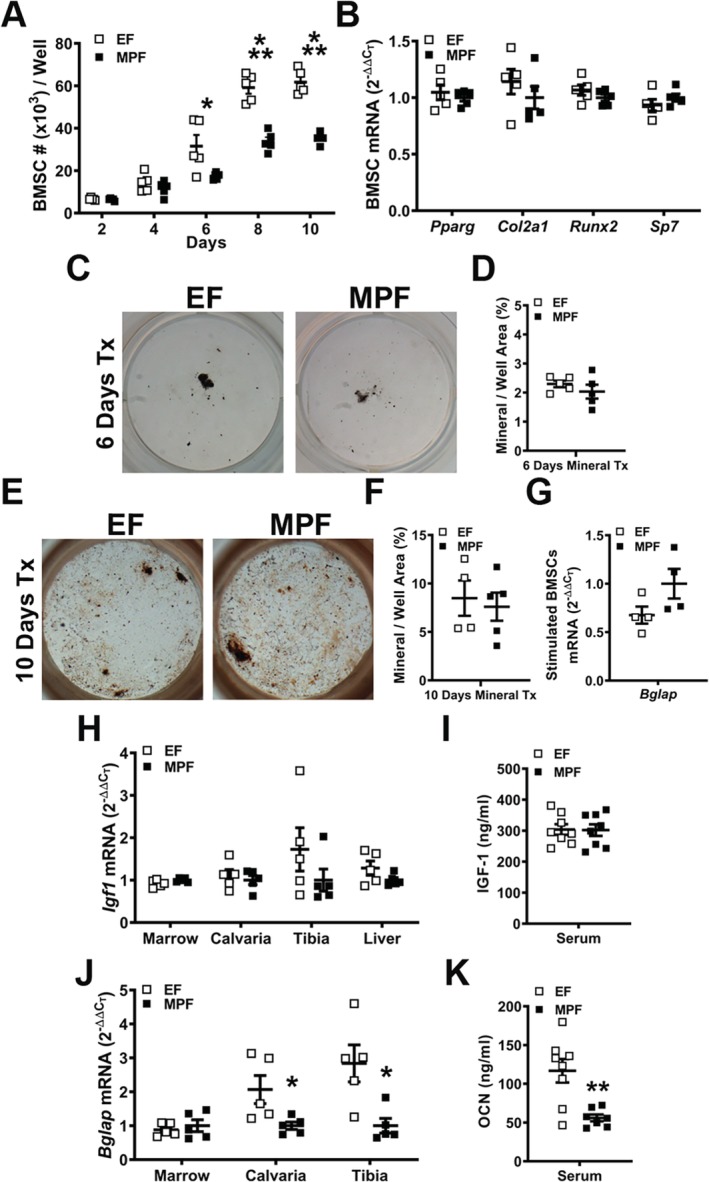
Figure 7.

Osteoblastogenesis analyses in excluded‐flora versus murine‐pathogen‐free mice. (A–G). Bone marrow stromal cell (BMSC) in vitro osteoblastogenesis assays. Bone marrow was harvested and BMSCs isolated for in vitro assays. (A) BMSC expansion assay (n = 5/gp): cell numbers over time in culture. (B) BMSC differentiation potential assay (BMSCs were cultured in growth media for 4 days and harvested preconfluent for qRT‐PCR analysis) to assess multipotent differentiation potential (n = 5/gp). Relative quantification of mRNA was performed via the comparative CT method (2−ΔΔCT). (C–D) von Kossa mineralization assay (6 day osteogenic media treatment) (n = 5/gp). (C) Representative von Kossa stained culture images. (D) Mineralization area per well area (%). (E,F) von Kossa mineralization assay (10 day osteogenic media treatment) (n = 4 to 5/gp). (E) Representative von Kossa stained culture images. (F) Mineralization area per well area (%). (G) BMSCs stimulated with osteogenic media for 5 days were isolated for qRT‐PCR analysis of Bglap (Ocn) mRNA (n = 4/gp). (H–K) in vivo regulation of osteoblastogenesis. (H) RNA was isolated from long bone marrow, calvaria, tibia, and liver (n = 5/gp) for qRT‐PCR analysis of Igf1. (I) Serum was isolated from whole blood (n = 8/gp); ELISA analysis of IGF‐1 levels. (J) RNA was isolated from long bone marrow, calvaria, and tibia (n = 5/gp) for qRT‐PCR analysis of Bglap. (K) Serum was isolated from whole blood (n = 8/gp); ELISA analysis of osteocalcin levels. Unpaired t test; data are presented as mean ± SEM, *p < 0.050, **p < 0.010, ***p < 0.001.
