Figure 8.

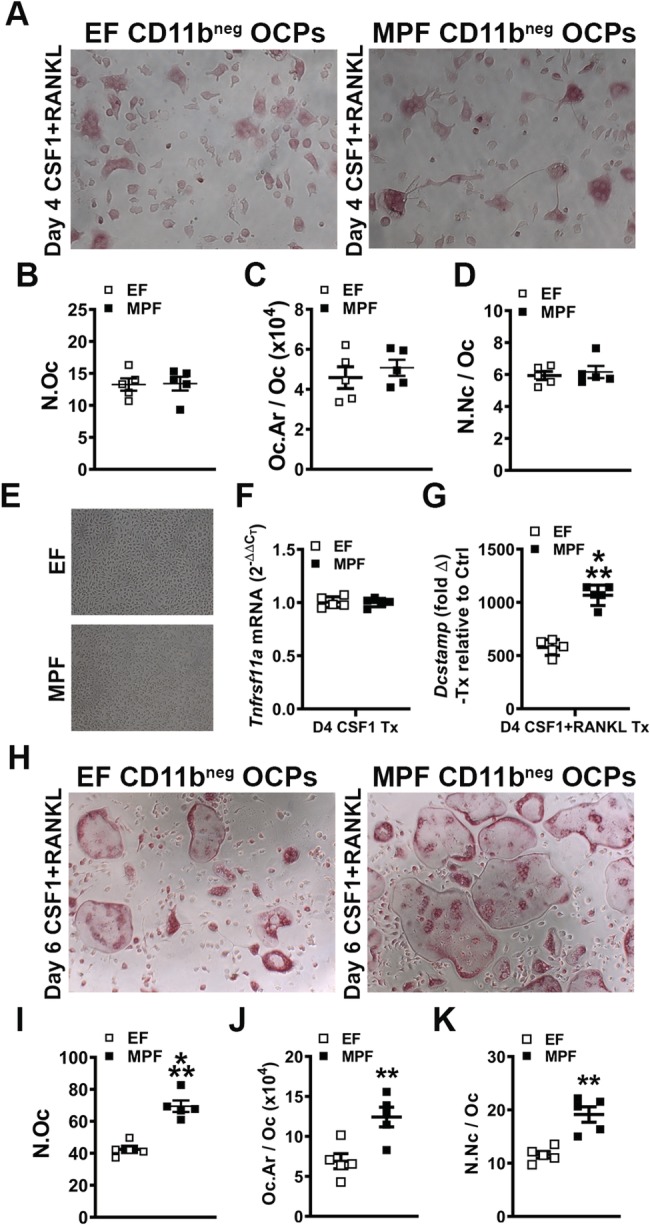
In vitro osteoclast‐precursor (OCP) cell differentiation assays in EF versus MPF mice. (A–D) Day 4 OCP culture tartrate‐resistant acid phosphatase stain assay (n = 5/gp). (A) Representative images (×100) of CD11bneg OCP cultures stimulated with treatment (CSF1 & RANKL) media for 4 days. (B) N.Oc = number of osteoclasts enumerated within four fields of view per well. (C) Oc.Ar/Oc = average osteoclast area. (D) N.Nc/Oc = nuclei number per osteoclast. (E) Representative images (×100) of CD11bneg OCP cultures stimulated with control (CSF1) media for 4 days. (F–G) qRT‐PCR gene expression studies were carried out in CD11bneg OCP cultures at day 4 to detect early transcription level alterations in RANKL‐stimulated osteoclast differentiation (n = 5/gp). (F) Tnfrsf11a (Rank) mRNA. Relative quantification of mRNA was performed via the comparative CT method (2−ΔΔCT). (G) Dcstamp mRNA. Relative quantification of mRNA was performed via 2−ΔΔCT; data expressed as treatment (CSF1 and RANKL) fold change relative to control (CSF1). (H–K) Day 6 OCP culture TRAP stain assay (n = 5/gp). (H) Representative images (×100) of CD11bneg OCP cultures stimulated with treatment (CSF1 & RANKL) media for 6 days. (I) N.Oc. (J) Oc.Ar/Oc. (K) N.Nc/Oc. Unpaired t test; data are presented as mean ± SEM, **p < 0.010, ***p < 0.001.
