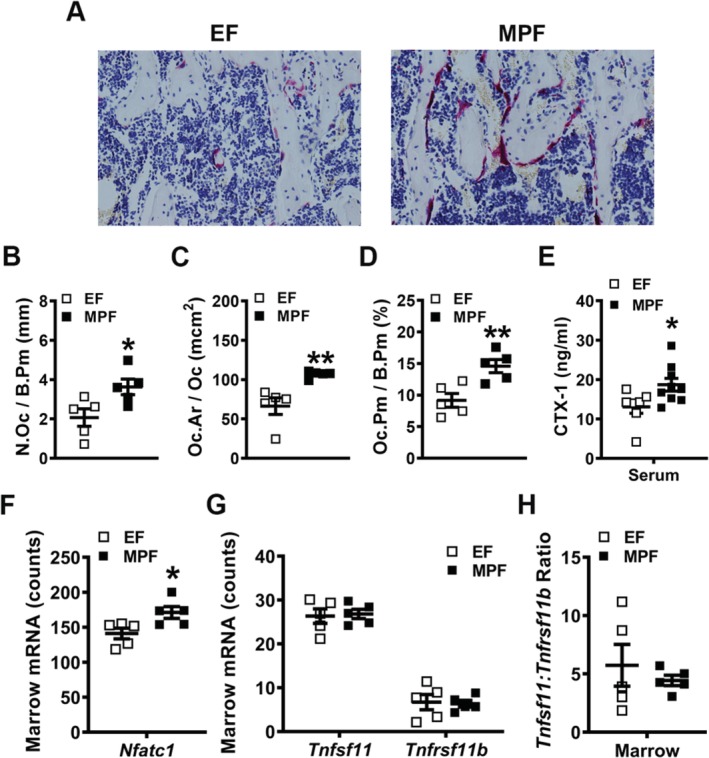
Figure 9.

In vivo osteoclastogenesis investigations in excluded‐flora versus murine‐pathogen‐free mice. (A–D) Histomorphometric analyses of tartrate‐resistant acid phosphatase+ (TRAP+) osteoclast cellular endpoints in the proximal tibia trabecular bone secondary spongiosa (n = 5/gp). (A) Representative images of TRAP‐stained secondary spongiosa in proximal tibia (×400). (B) N.Oc/B.Pm = osteoclast number per bone perimeter. (C) Oc.Ar/Oc = average osteoclast size. (D) Oc.Pm/B.Pm = osteoclast perimeter per bone perimeter. (E) Serum was isolated from whole blood (n = 7 to 8/gp); ELISA analysis of CTX‐1 levels. (F–H) Long bone marrow was harvested for gene expression analysis (n = 5/gp). (F) Nfatc1 mRNA counts. (G) Tnfsf11(Rankl) and Tnfrsf11b(Opg) mRNA counts. (H) Tnfsf11(Rankl):Tnfrsf11b(Opg) ratio. Unpaired t test; data are presented as mean ± SEM, *p < 0.050, **p < 0.010.
