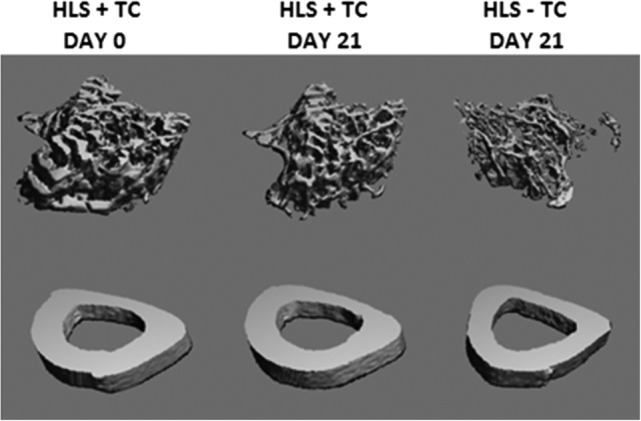
Figure 1.

Representative 3D μCT reconstructions of trabecular (top) and cortical midshaft (bottom) microstructure. All images were obtained from the same representative animal, which was selected based on overall proximity to the mean trabecular bone volume/total volume and cortical thickness values. The animal was hindlimb‐suspended with one limb subject to tibial compression (HLS + TC) and one limb without the compression (HLS − TC). Trabecular images represent 72 slices (756 um) of proximal tibia, immediately distal to the epiphyseal plate. Cortical images represent 22 slices (231 um) of the tibia midshaft. BV/TV = bone volume/total volume; HLS = hindlimb suspension; TC = tibial compression.
