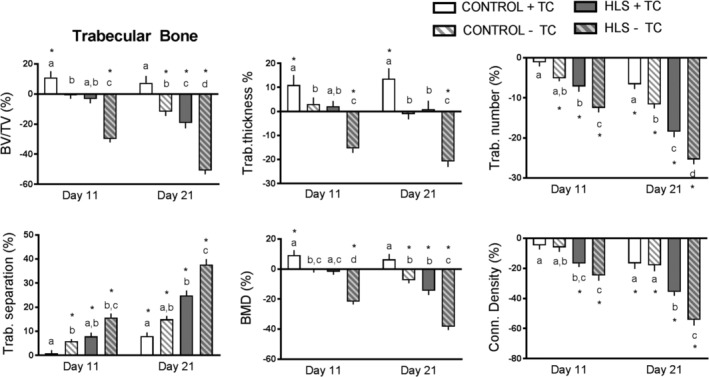
Figure 2.

Trabecular microstructural parameters obtained from longitudinal μCT of the proximal tibia metaphysis. Data are shown as percent change from baseline (day 0), with error bars indicating ± SEM. N = 10 to 15/group. Significant differences between groups within time‐points are indicated by assigned letters (p < 0.05). Significant differences between groups and baseline are indicated by *p < 0.05.
