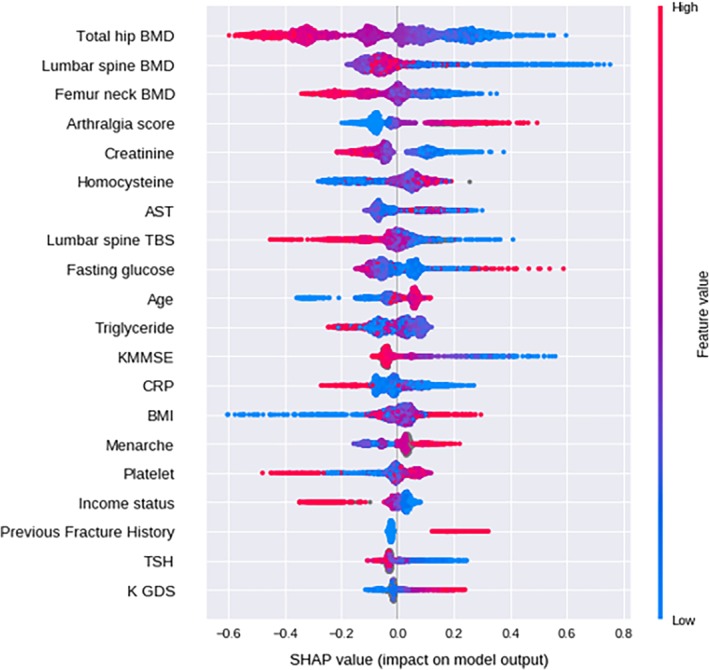
Figure 2.

Impact of features on prediction model output. Red and blue colors represent high and low levels of each predictor. The x‐axis represents the SHAP value. A positive SHAP value means likely to have a fracture; a negative value means unlikely to have a fracture. AST = aspartate aminotransferase; TSH = thyroid‐stimulating hormone (thyrotropin); TBS = trabecular bone score; KMMSE = Korean mini‐mental status examination; CRP = C‐reactive protein; K‐GDS = Korean geriatric depression score; SHAP = Shapley additive explanations.
