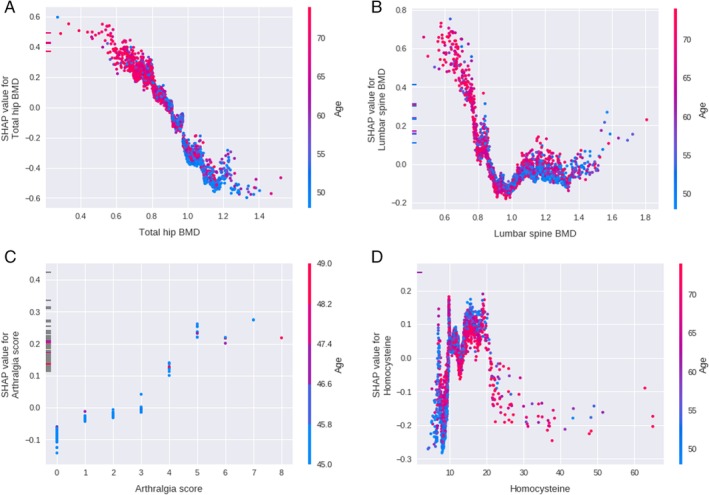
Figure 3.

Impact on prediction model output of (A) total hip BMD, (B) lumbar spine BMD, (C) subjective arthralgia score, and (D) homocysteine level. Red and blue colors represent old and young age. The y‐axis represents the SHAP value. A positive SHAP value means likely to have a fracture; a negative value means unlikely to have a fracture. SHAP = Shapley additive explanations.
