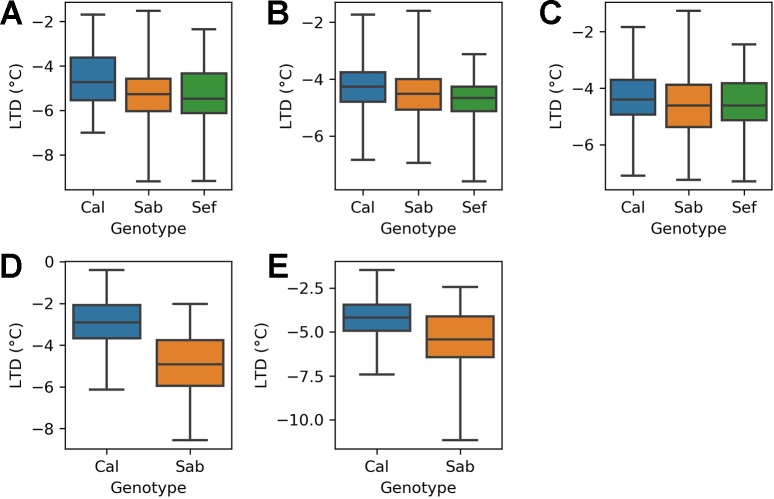
Figure 4.
Distribution of leaf temperature depression (LTD) observations by treatment and genotype for the H1 and H2 experiments: (A) H1 experiment - ambient treatment (B) H1 experiment - GH control treatment (C) H1 experiment - GH night heat treatment (D) H2 experiment - ambient treatment (E) H2 experiment - GH night heat treatment .

