
. 2020 Feb 28;11:19. doi: 10.3389/fpls.2020.00019
Copyright © 2020 Deva, Urban, Challinor, Falloon and Svitákova
This is an open-access article distributed under the terms of the Creative Commons Attribution License (CC BY). The use, distribution or reproduction in other forums is permitted, provided the original author(s) and the copyright owner(s) are credited and that the original publication in this journal is cited, in accordance with accepted academic practice. No use, distribution or reproduction is permitted which does not comply with these terms.
Figure 5.
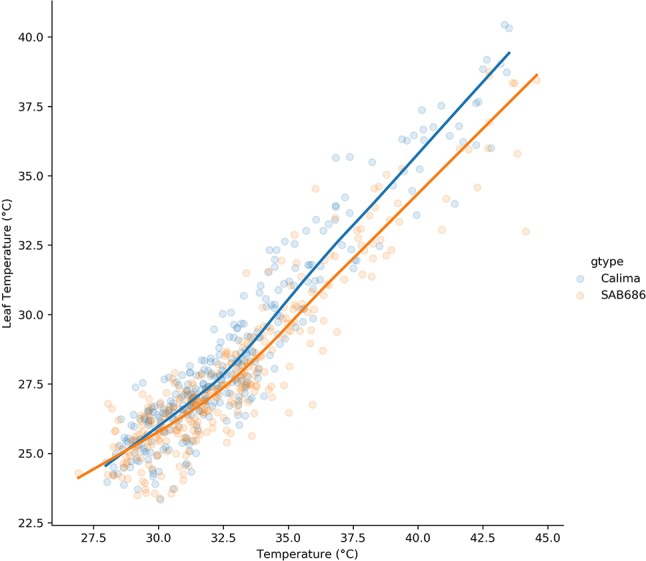
Lowess regression on the pooled data for Calima and SAB 686 from the H1 and H2 experiments.