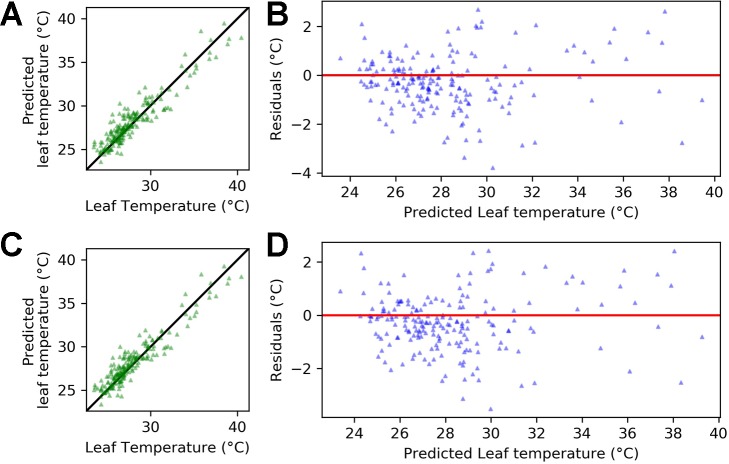
Figure 8.
Regression output for equations 8 and 9 applied to the pooled data for Calima and SAB 686 from experiments H1 and H2. (A) Leaf temperature vs. predicted leaf temperature - Equation 8 (B) Predicted leaf temperature vs. residuals - Equation 8 (C) Leaf temperature vs. predicted leaf temperature - Equation 9 (D) Predicted leaf temperature vs. residuals - Equation 9. In (A, C), the solid (identity) line represents perfect agreement.

