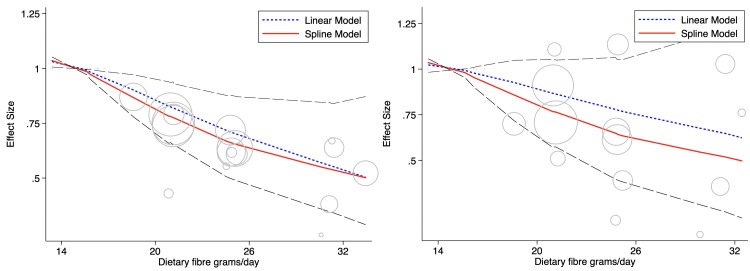
Fig 2.
Dietary fibre intake and all-cause (left) and CVD mortality (right) in cohorts with type 1 or type 2 diabetes. The 95% CIs are shown as dashed lines. Cohort data are presented as country specific estimates when possible. Circle size indicates the weighting of each data point, with bigger circles indicating greater influence. CVD, cardiovascular disease.

