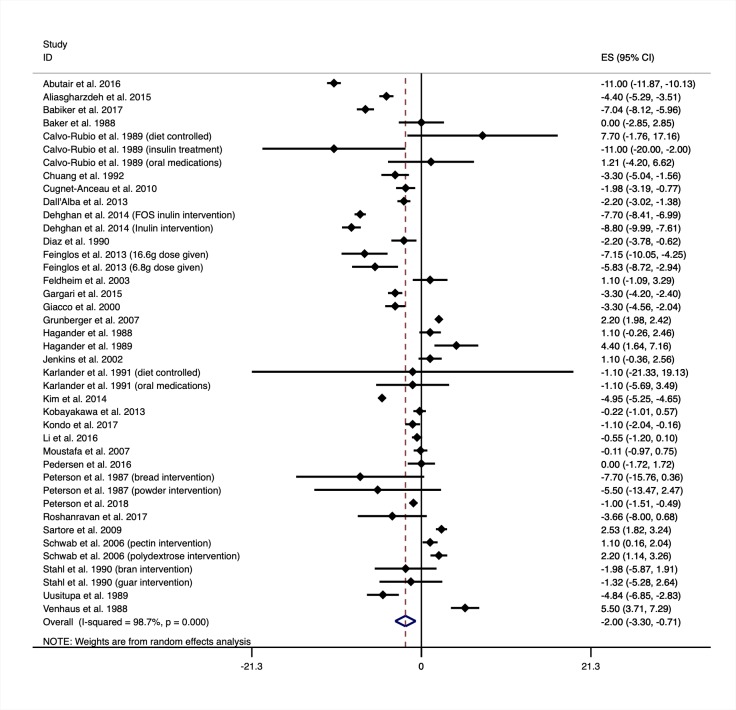
Fig 3. Mean difference in glycated haemoglobin (mmol/mol) between intervention and control groups from trials of increasing fibre intakes.
Negative values show a decrease in HbA1c when increasing fibre intakes (the intervention). Intervention description is shown in brackets next to the first author’s name and year published in which a trial reported on multiple eligible intervention arms. Medication regimen is also shown in brackets in which the results were reported separately and not as a mean result. ES, effect size; FOS, fructooligosaccharides.

