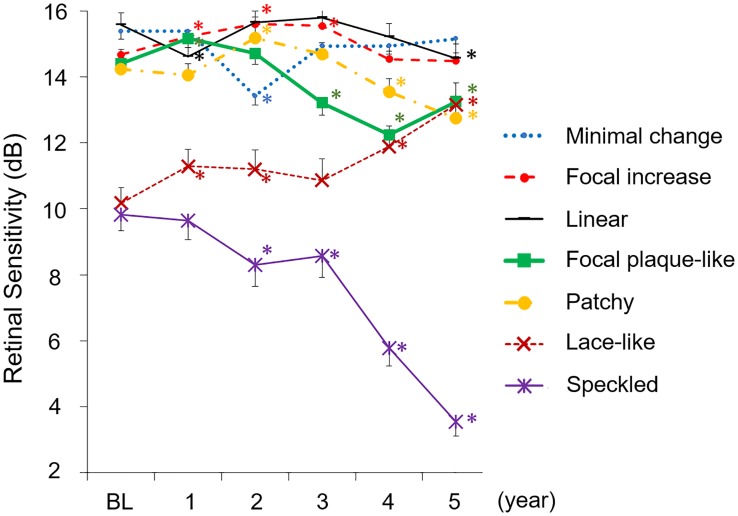
Fig 2. Transition of mean retinal sensitivity by each pattern of abnormal FAF during the 5 years.
The number of each pattern differs at each time-point compared to baseline (cf. Fig 1). The sensitivity of the linear, focal plaque-like, patchy, and speckled FAF pattern decreased significantly compared to the baseline at the 5th year. The speckled FAF pattern at the 5th year had the lowest mean retinal sensitivity. The sensitivity of lace-like increased significantly compared to baseline at the 5th year. Data are expressed as mean ± standard error (SE). * P < 0.05 compared to baseline, paired t-test. BL: baseline.

