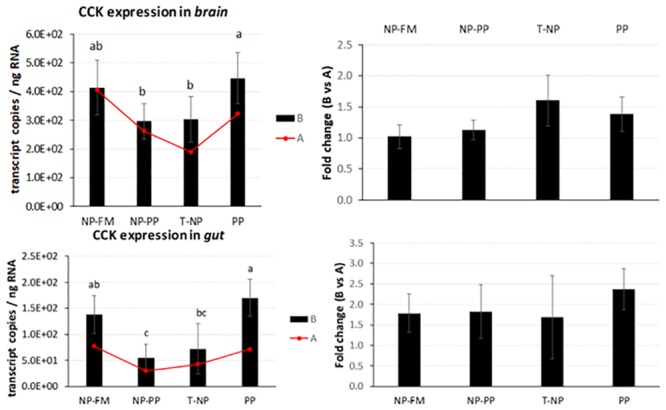
Fig 4. CCK expression in the brain and gut.

The expression of CCK presented as number of CCK transcript copies per ng of total RNA in zebrafish brain and gut at 3-hours (B) and 24-hours (A) after feeding. The fold change presents the difference in CCK transcript copies between 3 and 24-hour samples. Different letters indicate statistical difference at p <0.05.
