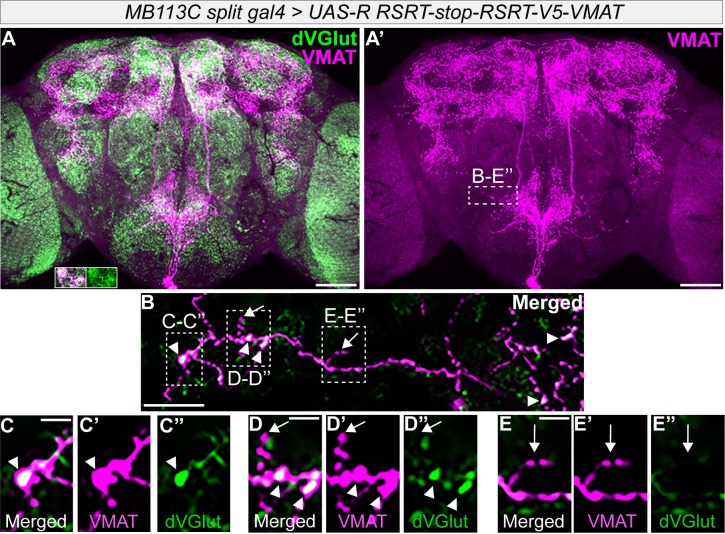
Fig 8. Spatial segregation of VMAT and dVGLUT within two OGNs.
(A-A’) Representative brain showing V5-VMAT expression in two OGNs after excision by MB113C-split-gal4 driven R recombinase. The brain is labeled with anti-V5 (magenta) and mAb dVGLUT (green). Scale bar is 50 μm. The inlet in A which is from a separate brain demonstrates this OA neuron driver also expresses dVGLUT (green). (B-E) Higher magnification of the SEZ boxed region in A’. Arrowheads point to puncta with V5-VMAT and dVGLUT, arrows indicate V5-VMAT only puncta. Scale bar is 10 μm. (C-E) The regions in the dashed boxes in B showing puncta with dVGLUT and V5-VMAT colocalization (arrowheads) and puncta with only V5-VMAT (arrows). Panels B-E contain stacks of four optical sections at 0.45 μm. Scale bar for panels C-E is 5 μm.

