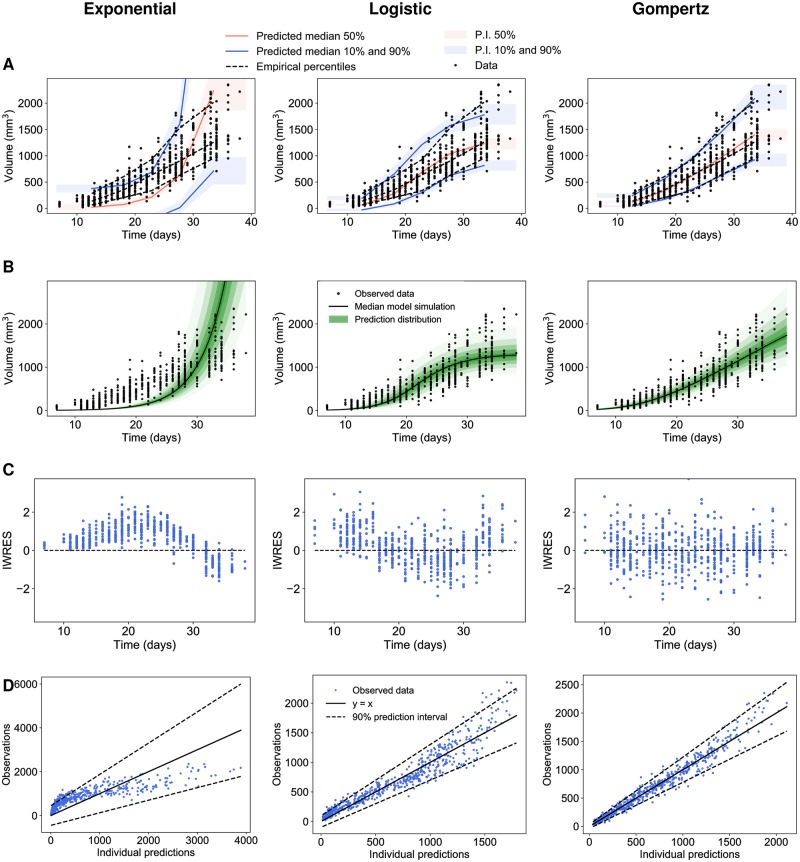
Fig 1. Population analysis of experimental tumor growth kinetics.
(A) Visual predictive checks assess goodness-of-fit for both structural dynamics and inter-animal variability by reporting model-predicted percentiles (together with confidence prediction intervals (P.I) in comparison to empirical ones. They were obtained by multiple simulations of each model. The time axis was then split into bins and in each interval the empirical percentiles of the observed data were compared with the respective predicted medians and intervals of the simulated data [47]. (B) Prediction distributions. They were obtained by multiple simulations of all individuals in the dataset, excluding the residual error [47]. (C) Individual weighted residuals (IWRES) with respect to time. (D) Observations vs predictions Left: exponential, Center: logistic, Right: Gompertz models.

