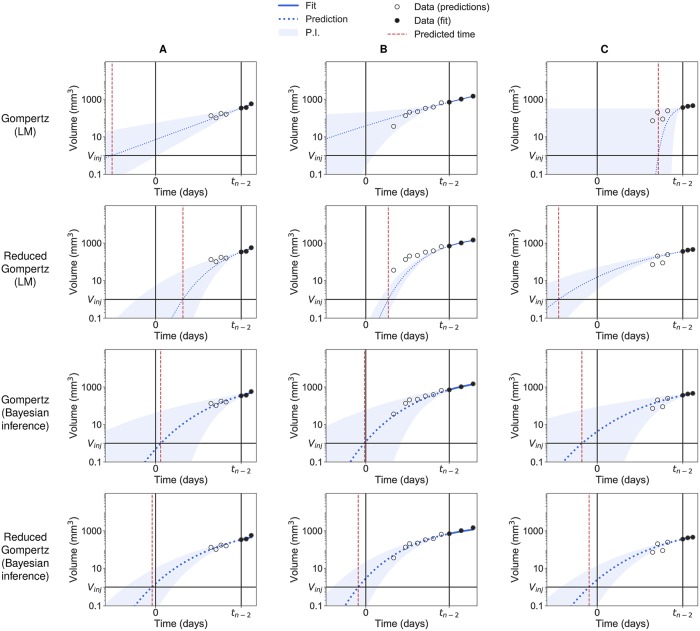
Fig 4. Backward predictions computed with likelihood maximization and with Bayesian inference.
Examples of backward predictions of three individuals (A), (B) and (C) computed with likelihood maximization (LM) and Bayesian inference: Gompertz model with likelihood maximization (first row); reduced Gompertz with likelihood maximization (second row); Gompertz with Bayesian inference (third row) and reduced Gompertz with Bayesian inference (fourth row). Only the last three points are considered to estimate the parameters. The grey area is the 95% prediction interval (P.I) and the dotted blue line is the median of the posterior predictive distribution. The red line is the predicted initiation time and the black vertical line the actual initiation time.

