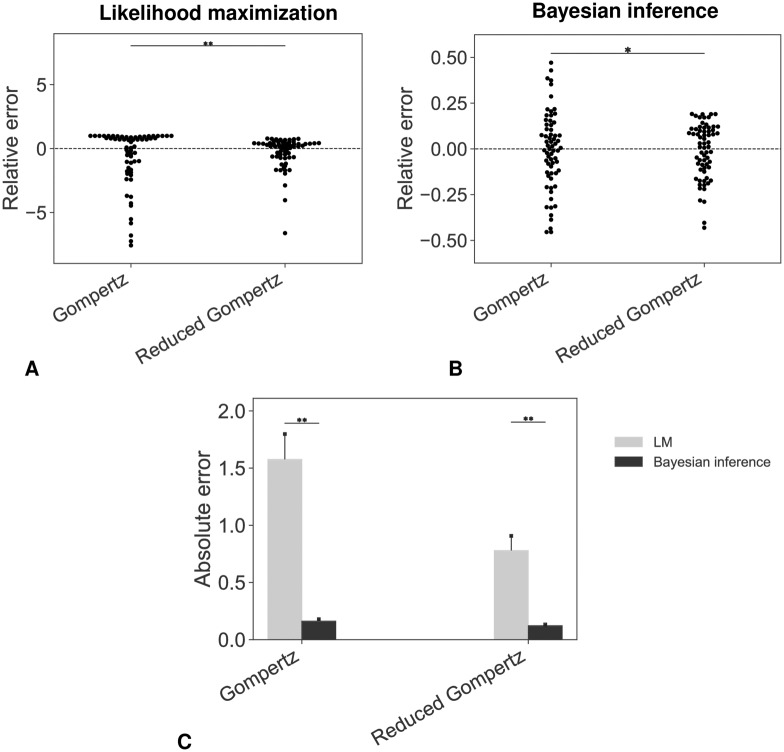
Fig 5. Accuracy of the prediction models.
Swarmplots of relative errors obtained under likelihood maximization (A) or Bayesian inference (B) (* p-value < 0.05, ** p-value < 0.01, Levene’s test). (C) Absolute errors: comparison between the different distributions (* p-value < 0.05, ** p-value < 0.01, Wilcoxon test). In (A) three extreme outliers were omitted (values of the relative error were greater than 20) for both the Gompertz and the reduced Gompertz in order to ensure readability. LM = Likelihood Maximization.

