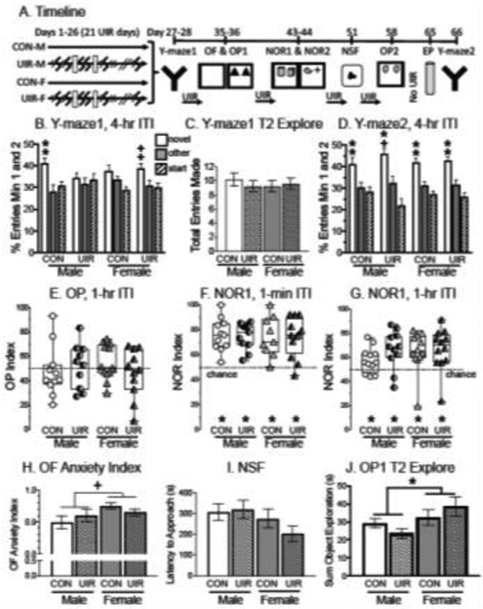
Fig. 4:
Effects of a novel UIR paradigm on spatial ability and anxiety profiles in both male and female rats. A) Timeline of manipulations. The stressor was 30-min (small zigzag) or 60-min (large zigzag) restraint with gentle shaking. White-filled rectangles indicate when rats were given a day off. After 28 days of UIR (which was 21 days of actual restraint), rats were tested on the Y-maze and then returned to the UIR paradigm as indicated. At the end of UIR, rats were given seven days before being placed on the EP for 30-min and then tested one day later on the Y-maze. B) Y-maze1 performance on trial 2 after 26 days of UIR for entries in the first two minutes after a 4-hr ITI. CON entered (and spent more time in, data not shown) the novel arm than the other arm. UIR-F tended to enter (and spend more time in, data not shown) the novel arm than the other arm. UIR-M and CON-F performed at chance levels. Two symbols indicate significance or tendency toward significance in both entry and dwell measures. C) Entries made in all three arms of the Y-maze1 during Trial 2 for the first two minutes. The groups made a similar number of total entries during trial 2 of the Y-maze to demonstrate similar motivation to explore. D) Y-maze2 performance following seven days after the end of UIR and one day after EP (post-EP) for entries made in minutes 1 and 2 during trial 2 after a 4-hr ITI. CON-M, UIR-M, CON-F and UIR-F entered (and spent more time in, data not shown) the novel arm more than the other arm. Chance is denoted by the dashed horizontal line. Two symbols indicate significance (or tendency toward significance) in both entry and dwell measures. E) OP1 performance after 36 days of UIR. The OP Index reflects time spent with the moved object compared to total time spent with both objects in the second trial after a 1-hr ITI. Preference for the moved object will show values greater than 0.5 with the dashed horizontal line indicating chance levels. All groups performed at chance. F) NOR performance after 43 days of UIR. The NOR Index reflects time spent with the novel object compared to total time with both objects in the second trial with a 1-min ITI. Preference for the new object will show values greater than 0.5 with the dashed horizontal line indicating chance levels. All groups spent more time with the new object than the familiar object to demonstrate that they were able to recognize the new object when cognitive load was minimal. G) NOR performance after 44 days of UIR, with the NOR Index from the second trial with a 1-hr ITI. All groups spent more time with the new object than the familiar object even with a longer delay than the day before. H) OF anxiety index. Female rats tended to have an elevated anxiety profile compared to male rats, but this does not explain the poor performance on OP for all groups. I) NSF latency to feed. The time it took for rats to approach the chow was similar across groups. J) The total time spent exploring both objects in OP1 during trial 2 after 36 days of UIR. Female rats spent significantly more time exploring both objects compared to male rats. There were no other group differences. *p < 0.05, +p < 0.1, CON-M = control males, UIR-M = unpredictable intermittent restraint males, CON-F = control females, UIR-F = unpredictable intermittent restraint females.

