Figure 2.

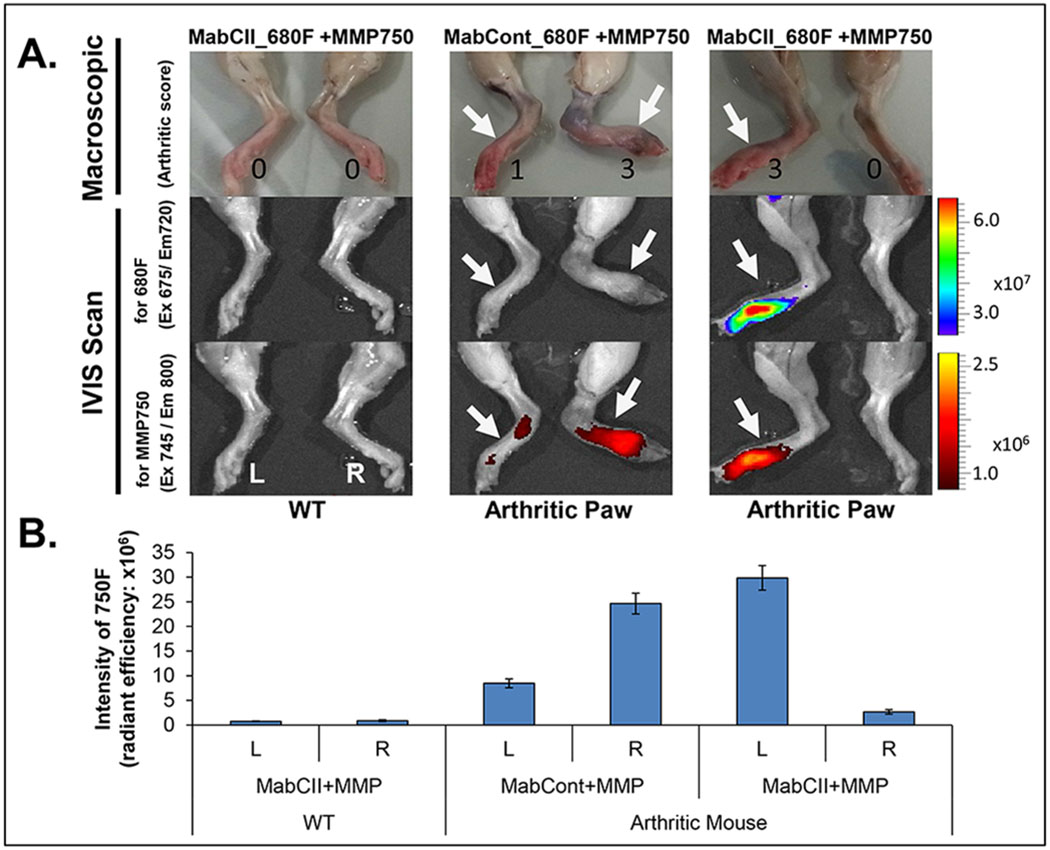
Analysis of joints in normal and arthritis mice. (A) Macroscopic and IVIS analysis. (B) Graphical representation of inflammation. MMP activity was measured as intensity of 750F. Data is expressed as mean ± SD

Analysis of joints in normal and arthritis mice. (A) Macroscopic and IVIS analysis. (B) Graphical representation of inflammation. MMP activity was measured as intensity of 750F. Data is expressed as mean ± SD