. 2020 Feb 21;9:e53704. doi: 10.7554/eLife.53704

Figure 1. Primary and secondary response to yellow fever vaccination.

(A) Experiment design. Blood was taken at multiple timepoints before and after primary and secondary immunization against yellow fever virus. Two biological replicates of PBMCs and different cell subpopulations (indicated below each day of blood draw) were isolated at all timepoints. cDNA TCR alpha and TCR beta libraries were sequenced on Illumina platform. (B) The number of significantly expanded TCR alpha and TCR beta clonotypes for both donors in comparison to day 0. For donor P30 the number of significantly expanded clones is lower, than observed in primary vaccinations (see Figure 1—figure supplement 2). (C) The fraction of YF-responding cells as a proportion of all T-cells, measured by cumulative frequency of YF-responding TCR alpha and beta clonotypes of donor M1 after first (light blue and dark blue) and second immunization (dashed light blue and dark blue), and donor P30 (orange and yellow), which had a second immunization 30 years after the first. (D) The fraction of CD4+ and CD8+ YF-responding cells, as a proportion of all T-cells of donor M1 during the primary and secondary response to YFV17D. No novel major expansions were observed after secondary immunization, see Figure 1—figure supplement 1.

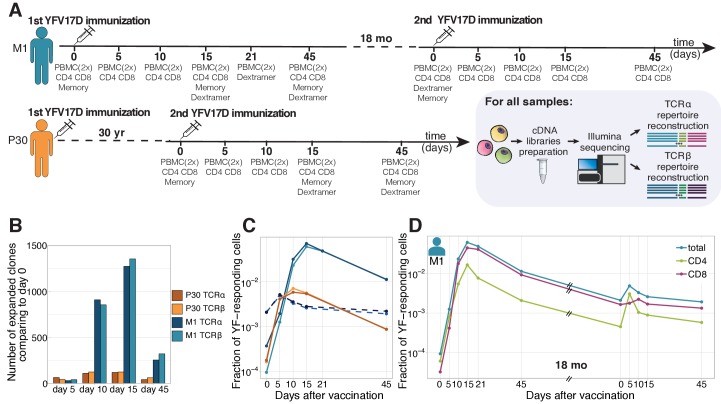
Figure 1—source data 1. List of all sequencing libraries with summary statistics.
Figure 1—source data 2. Number of significantly expanded TCR alpha and TCR beta clonotypes between in comparison to day 0.
Figure 1—source data 3. YF-responding TCR alpha and TCR beta clonotypes of donors M1 and P30 identified by edgeR.
elife-53704-fig1-data3.xlsx (315.5KB, xlsx)

Figure 1.

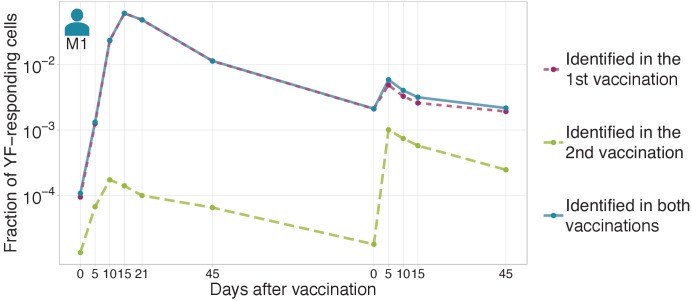
Figure 1—figure supplement 1. The magnitude of secondary response in donor M1 identified by edgeR.

Figure 1—figure supplement 1.

The fraction of YF-responding cells as a proportion of all T-cells, measured by cumulative frequency of YF-responding TCR beta clonotypes of donor M1 identified by edgeR using timepoints after first vaccination (dashed purple), or after the second vaccination (dashed green). Solid blue line shows the sum of purple and green curves (clonotypes identified as expanded after first or after second immunization).
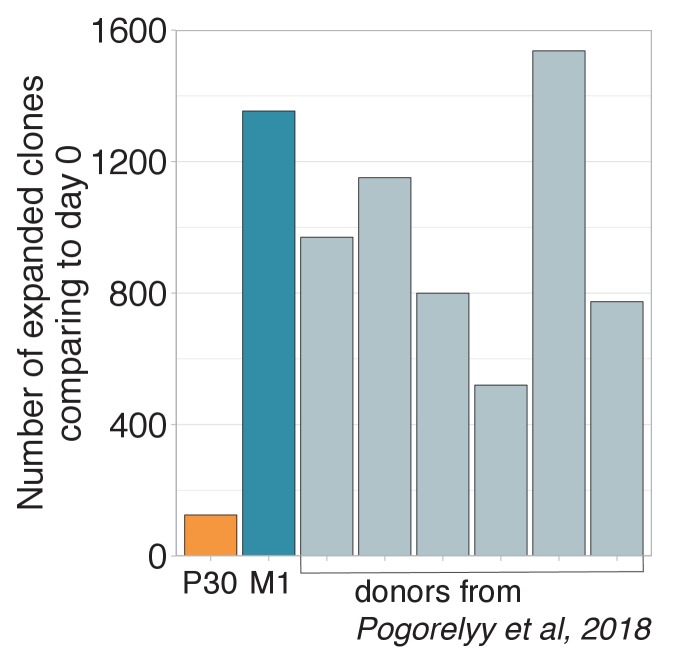
Figure 1—figure supplement 2. Number of expanded clones in donor P30.

Figure 1—figure supplement 2.

Number of significantly expanded TCR beta clonotypes between day 0 and 15 identified by the edgeR software. The donor revaccinated 30 years after the primary immunization has significantly fewer expanded clonotypes than any primary vaccinee.