
Figure 2. Diversity of individual clonal trajectories in primary and secondary responses.
(A, B) Frequency of each YF-responding clonotype in bulk TCR repertoire as a function of time. Individual clones show remarkable expansion after the primary response (A, left panel) and secondary response both 18 months (A, right panel) and 30 years (B) after the primary vaccination. The ten most abundant (by peak frequency) CD4+ and CD8+ YF-responding clonotypes are shown for each vaccination. Clonal traces for all YF-responding clonotypes are shown in Figure 2—figure supplement 1. Color indicates the time of the response peak for each clonotype: blue for a peak at day 5, pink at day 10, green at day 15 and purple at day 21. Despite overall heterogeneity in clonal traces, more clones peak at early timepoints during the secondary response. Heterogeneity in clonal traces allows for expanded clones identification and computational alpha-beta TCR pairing (Figure 2—figure supplement 4).

Figure 2—figure supplement 1. Time traces of all YF-responding clonotypes.

Figure 2—figure supplement 2. Decay of YF-responding clonotypes between primary and secondary immunization.
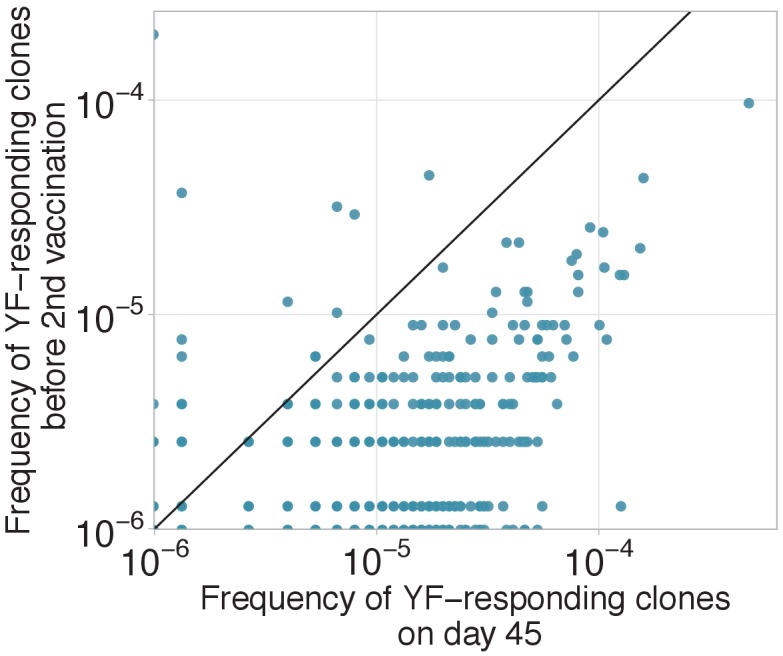
Figure 2—figure supplement 3. Frequencies of CD8+ and CD4+ YF-responding clonotypes before and after secondary immunization.

Figure 2—figure supplement 4. Clustering of time traces allows for expanded clones identification and computational TCR alpha-beta chain pairing.
