. 2020 Feb 21;9:e53704. doi: 10.7554/eLife.53704

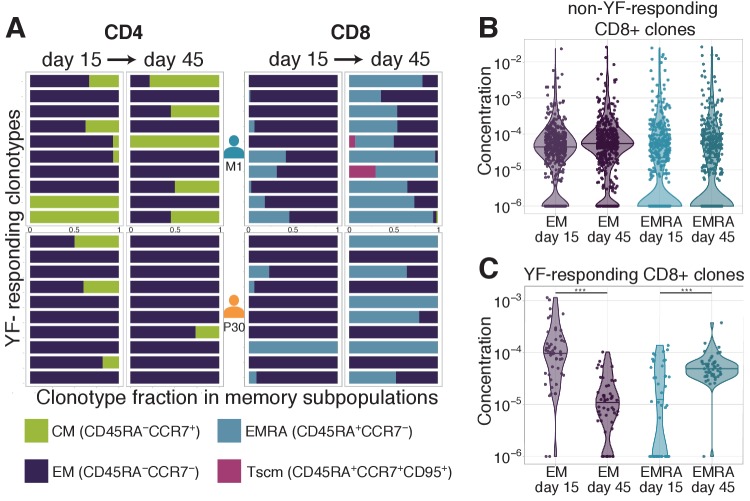
Figure 3. Distribution of clonotypes in memory subsets.

(A) Each color bar shows the estimated distribution of T-cell clones between memory subpopulations for a set of CD4+ (left panel) and CD8+ (right panel) clonotypes for donors M1 (top) and P30 (bottom) on day 15 and day 45. Each panel shows the 10 most abundant YF-responding clones in each donor on day 45, which are present in at least one memory subpopulation on both day 15 and day 45. (B) Estimated concentration of CD8+ clones with a given phenotype at different timepoints in the bulk PBMC repertoire, for non-YF-responding clonotypes and (C) YF-responding CD8+ clonotypes (Mann Whitney U-test, EM: p-value = 2.1 · 10-12, EMRA: p-value = 1.2 · 10-6). Only clones with 30 or more Unique Molecular Identifiers (see Materials and methods) in bulk repertoires on day 45 were used for the analysis.

Figure 3—source data 1. Distribution of 10 most abundant CD4+ and CD8+ YF-responding clonotypes from donors M1 and P30 between memory subsets.
Figure 3—source data 2. Concentrations of non-YF-responding CD8+ clones in EM and EMRA subsets on day 15 and day 45.
Figure 3—source data 3. Concentrations of YF-responding CD8+ clones in EM and EMRA subsets on day 15 and day 45.

Figure 3.

Figure 3—figure supplement 1. Gating strategy for memory subpopulations.

Figure 3—figure supplement 1.

Central memory (CM) cells were defined as CD3+CCR7+CD45RA-. Effector memory (EM) cells were CD3+CCR7-CD45RA-. Terminally differentiated effector memory (EMRA) cells were CD3+CCR7-CD45RA+. Stem-cell like memory (Tscm) cells were CD3+CCR7+CD45RA+CD95+.
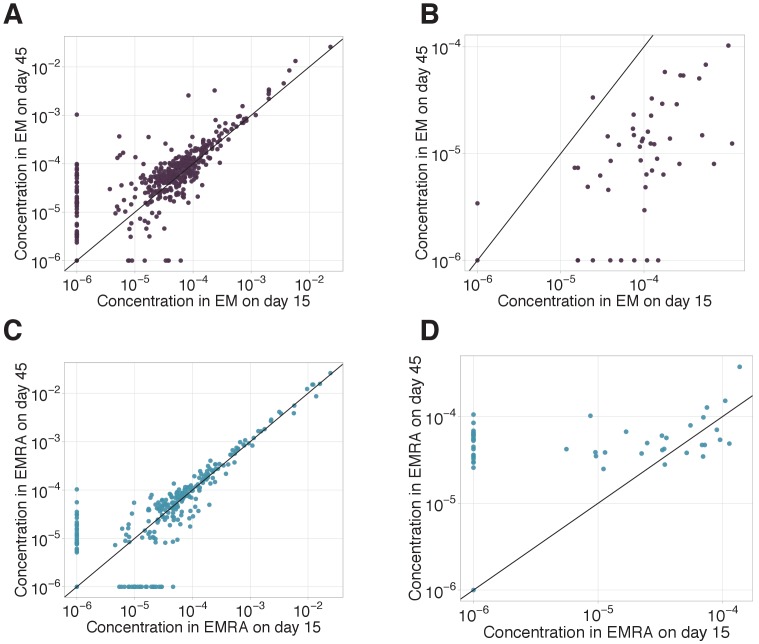
Figure 3—figure supplement 2. EM-EMRA transition and decay of CD8+ clones between day 15 and day 45.

Figure 3—figure supplement 2.

EM-EMRA transition and decay of CD8+ clones between day 15 and day 45. We plot concentrations of EM (A, B) and EMRA (C, D) of CD8+ cells of each clone with ≥ 30 UMI on day 45 in the bulk repertoire for non-YF-responding (A, C) and YF-responding (B, D) CD8+ clones on day 15 (x-axis) versus day 45 (y-axis). Diagonal line shows identity.