. 2020 Feb 21;9:e53704. doi: 10.7554/eLife.53704

Figure 4. Response to the immunodominant yellow fever epitope NS4B214-222.

(A) Fraction of all T-cells corresponding to CD8+ YF-responding TCRβ clonotypes (solid lines) and CD8+NS4B-specific clonotypes (dashed lines) as a function of time post-vaccination (x-axis). Sequence similarity networks for TCR alpha (B) and beta (C) of NS4B-positive cells. Each vertex is a TCR amino acid sequence, connected with an edge if they differ by fewer than two mismatches. The size of the vertex indicates its degree. Vertices of zero degree are not shown. Color and text boxes indicate V-segments that are significantly enriched (exact Fisher test, Benjamini Hochberg adjusted p<0.001) in usage in epitope-specific cells compared to the bulk repertoire. NS4B-specific TCR alpha (D) and TCR beta (E) chains (red histograms) have biases in CDR3 length in comparison to bulk TCR repertoire of CD8+ cells (overlayed blue histograms). (F) Network of single-cell paired TCR alpha (blue) and TCR beta (red) of NS4B-specific TCRs. Vertices of the same color are connected if there are less than two mismatches in TCR chain amino acid sequence. An edge between vertices of different color represents the pairing of alpha and beta. The biggest alpha cluster (blue in the center) corresponds to the TRAV12-2 cluster on B, and it pairs with many dissimilar beta chains. The biggest beta cluster (top left in red) corresponds to the TRBV9 cluster of C. (G) Pairing of V-segments of TCR alpha (left) to V-segments of TCR beta (right) in scTCRseq of NS4B-specific T-cells. The height of each box is proportional to the number of unique clones with this V-segment. The width of ribbons is proportional to the frequency of TRAV-TRBV combination. NS4B-specific TCRs have two main binding modes, defined by TRAV12 segment family paired to almost any TRBV (blue) and by TRAV27 segment paired preferentially with TRBV9 (pink).

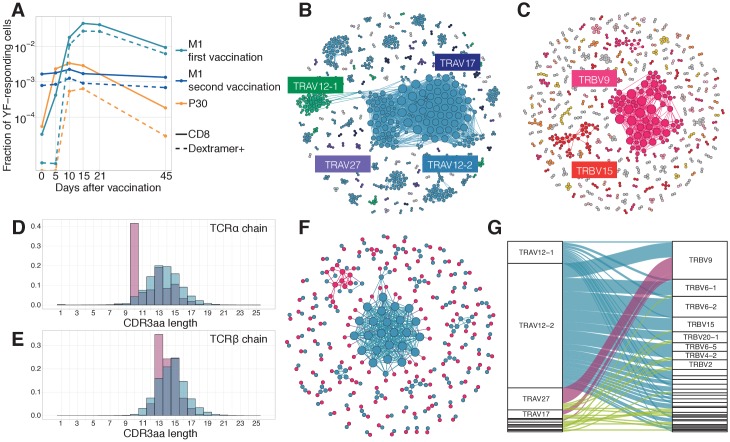
Figure 4—source data 1. NS4B-specific TCR alpha and TCR beta clonotypes from donors M1 and P30.
elife-53704-fig4-data1.xlsx (200.6KB, xlsx)
Figure 4—source data 2. Paired NS4B-specific alpha/beta TCR clonotypes.

Figure 4.

Figure 4—figure supplement 1. Isolation of NS4B-specific T-cells.

Figure 4—figure supplement 1.

Isolation of NS4B-specific T-cells of donor M1 (A) and donor P30 (B) on different timepoints after YF vaccination. (C) Number of NS4B-dextramer-positive cells before (left) and after (right) enrichment on the magnetic beads. FACS was performed on donor M1 before the second immunization.
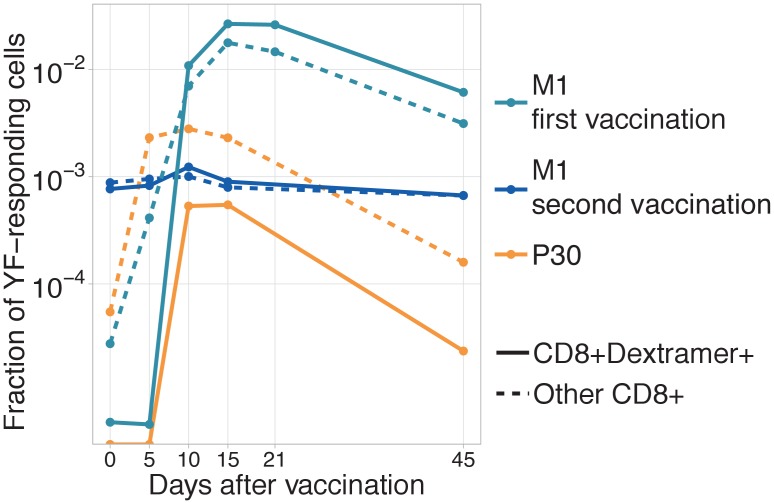
Figure 4—figure supplement 2. Dynamics of immunodominant response and other responses.

Figure 4—figure supplement 2.

Dynamics of immunodominant response and other responses. Total frequency of YF-responding NS4B-dextramer positive (solid line) and other YF-responding CD8 clonotypes (dashed line) is plotted on different timepoints after immunization. All clonotypes are called YF-responding using edgeR. .
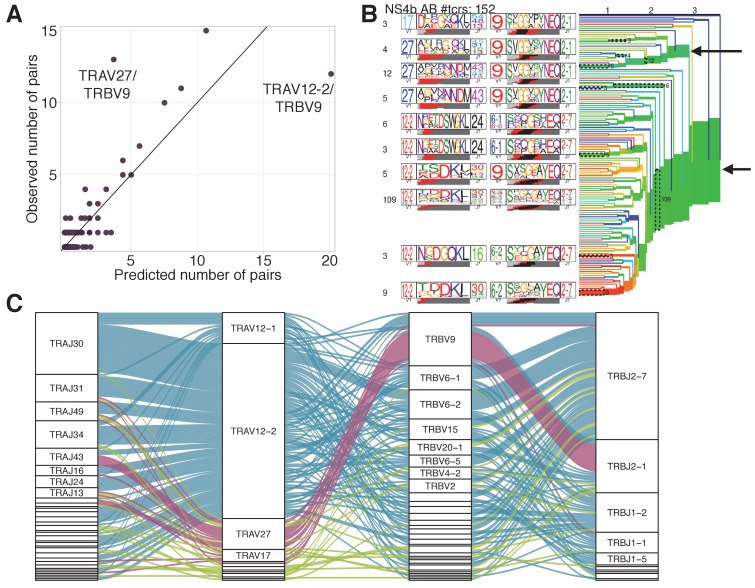
Figure 4—figure supplement 3. TRAV-TRBV pairing in NS4B-specific TCRs.

Figure 4—figure supplement 3.

(A) TRAV-TRBV pairing in NS4B-dextramer-positive TCRs. Each dot shows TRAV-TRBV combination. The observed number of clonotypes using this combination in TCR is plotted against the number expected under random pairing from TRAV and TRBV frequencies. TRBV9 is expected to form more pairs with TRAV12-2 but pairs with TRAV27 instead, suggesting the existence of selective pressure on the choice of both chains. (B) Results of TCRdist hierarchical clustering of paired scTCR repertoire of NS4B-specific cells. The two largest branches indicated with arrows correspond to TRAV12-2 and TRAV27-TRBV9 motifs. (C)Pairings of J-segments and V-segments of TCR alpha (left) to V-segments and J-segments of TCR beta (right) in scTCRseq of NS4B-specific T-cells. The height of each box is proportional to the number of unique clones with a given gene segment. The width of the ribbons is proportional to the frequency of segment combinations. NS4B-specific TCRs have two main binding modes, defined by the TRAV12 segment family paired to almost any TRBV (blue) and by the TRAV27 segment paired preferentially with TRBV9 (pink). Other combinations are shown in green. .
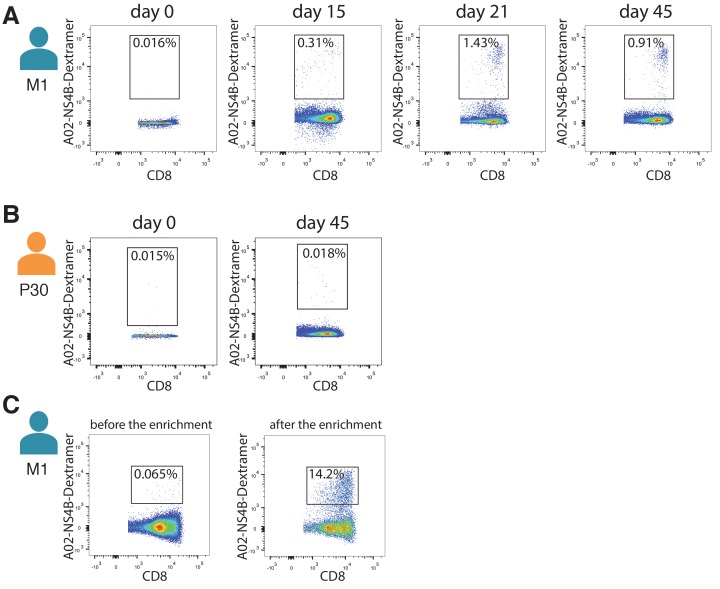
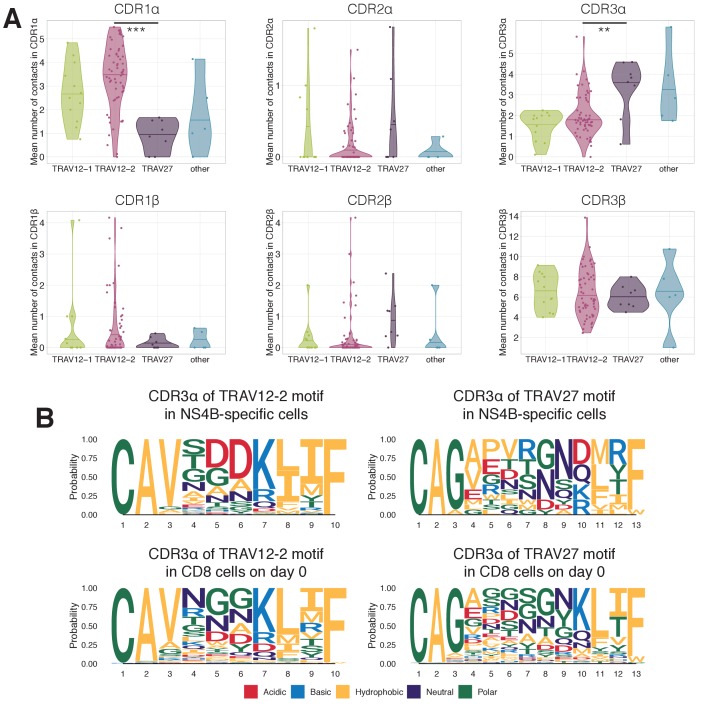
Figure 4—figure supplement 4. Structural motifs in NS4B-specific TCRs.

Figure 4—figure supplement 4.

(A) Average number of contacts to the LLWNGPMAV peptide in complementary determining regions of TCR alpha (top) and TCR beta (bottom) chains. TCRs with TRAV12 segment (green and pink) have significantly more contacts ( Mann Whitney U-test p-value=0.00015) in CDR1α than TCRs with TRAV27 (purple). On the other hand TCRs with TRAV27 have more contacts in CDR3α than TRAV12-2 TCRs ( Mann Whitney U-test p-value=0.009). No significant difference in the number of contacts was observed for these binding modes in CDRs of the TCR beta chain. (B) Frequency of amino acids in CDR3s of clones with TRAV12-2 and TRAV27 V-segments in dextramer-sorted NS4B-specific clonotypes and bulk CD8 clonotypes prior to the vaccination. For TRAV12-2 motif frequency distribution for TRAV12-2 is close to observed in bulk, suggesting absence of strong selection for certain amino acids in certain positions. .