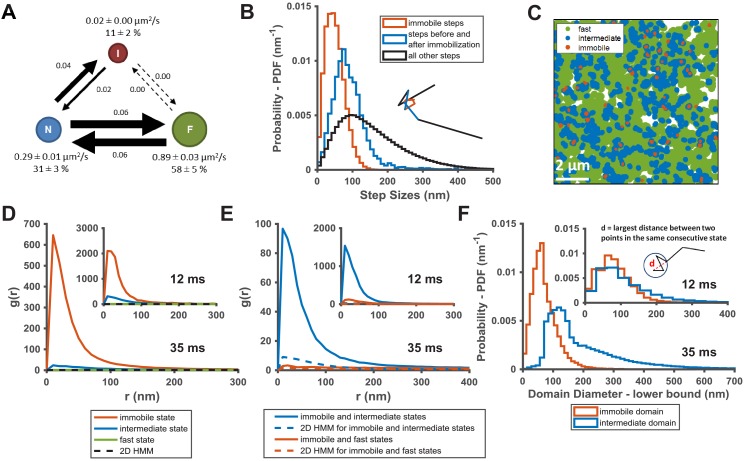
Figure 2. KRasG12D diffusion states are associated with distinct membrane domains.
(A) The three-state model for KRasG12D diffusion with F, N, and I, representing the fast, the intermediate, and the immobile states, respectively. Model parameters were inferred using vbSPT on spt-PALM datasets with at least 30,000 trajectories obtained on cells induced with 2 ng/mL Dox. The arrows indicate state transitions (i.e. the probability of switching to a different state in the next frame) and the area of the circle and the thickness of the arrows are both roughly scaled to reflect their relative values. All parameters were derived from data acquired at 12 ms frame interval except for the diffusion coefficient of the immobile state, which was inferred from data taken at 35 ms frame interval. Error bars are 95% CIs (n = 8); (B) Step size histograms for immobilization events (red), one step before or after the immobilization event (blue), and all other steps (black). A diffusion step was part of an immobilization event if immobile state was assigned to that trajectory segment by vbSPT (n = 14, see Materials and methods); (C) Map of the membrane locations where KRasG12D molecules exhibit specific diffusion states (referred to as state coordinates) within a one-minute duration (taken from a spt-PALM dataset of ~20 min total duration). Red, blue, and green dots represent locations of the immobile, the intermediate, and the fast states, respectively, with each rendered circles scaled proportionally to the mean diffusion coefficient for the state; (D) Pair correlation analysis on the averaged state coordinates across multiple, one-minute segments of longer spt-PALM datasets. The same color coding as in B) was used to distinguish the three states. For this analysis, molecules in the same diffusion state in successive frames only contributed a single, averaged state coordinate. The average state coordinates of all molecules captured within a one-minute segment were used for correlation analysis, and the results from multiple one-minute segments were averaged to yield the plot. The negative control was generated through a 2D Markovian simulation, and the resulting trajectories were analyzed the same as the experiment (see Materials and methods); (E) Cross correlation analysis between pairs of diffusion states. The state coordinates were processed the same way as in D) prior to the correlation analysis, except that the correlation was performed between two different diffusion states. The negative control was generated through a 2D Markovian simulation, and the resulting trajectories were analyzed the same as the experiment (see Materials and methods); (F) Estimating the lower bound size for the immobile and the intermediate domains. The estimation was based on the maximum distance traveled by the molecule while in the same diffusion state. *D-F) The main panel shows results inferred from data taken at 35 ms frame intervals for improved localization precision. The inset shows the data taken at 12 ms/frame (n = 14 for 12 ms and n = 7 for 35 ms datasets).


