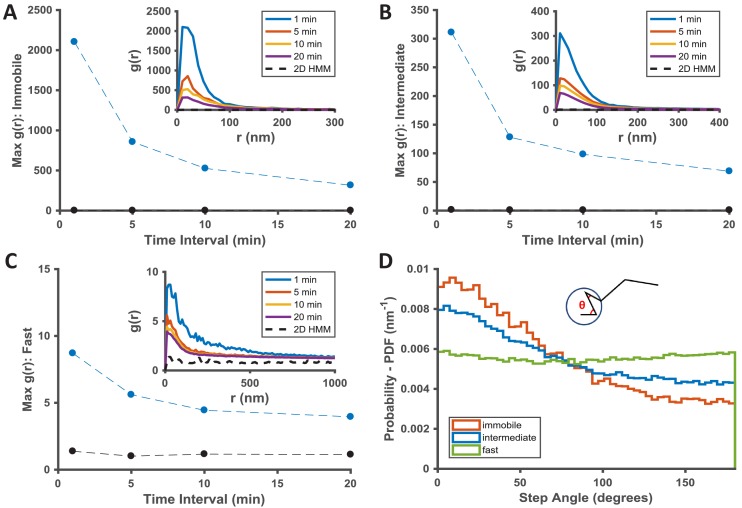
Figure 3. Temporal properties of the KRasG12D-associated immobile and intermediate domains.
(A–C) Pair correlation analysis of the state coordinates at different time intervals (1, 5, 10, and 20 min). The amplitude (maximal g(r) value) of the pair correlation function at each time interval was plotted in the main panel with the raw pair correlation plots shown in the inset. A-C show pair correlation functions of averaged coordinates for the immobile, the intermediate, and the fast states, respectively (see Materials and methods). The negative control in each case was generated through a 2D Markovian simulation, and the resulting trajectories were analyzed the same as the experiment (see Materials and methods); D) Deflection angle analysis on KRasG12D diffusion trajectories separated by diffusion states (red: immobile; blue: intermediate; green: fast). The deflection angle was calculated as the angle between two successive segments of the trajectory while the molecule was in the same diffusion state. *Results shown for data acquired at 12 ms/frame (n = 14).

