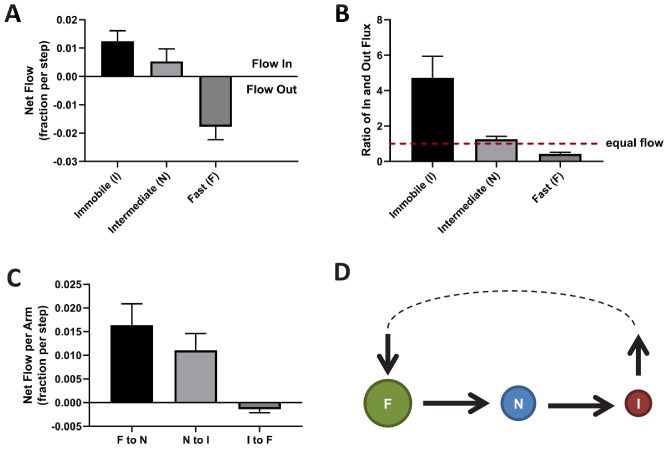
Figure 5. Directional mass flow between KRasG12D diffusion states.
(A) Net mass flow per state, defined as the difference between the influx (positive) and the outflux (negative) for each state and expressed as the fraction (of total KRasG12D population) entering (positive, flow in) or leaving (flow out, negative) the state per time interval; (B) Ratio of in- and outflux for each state. A ratio of one (dashed line) represents equal in- and outflux for the state, greater than one represents more influx than outflux, and less than one represents net outflux of mass from the state; (C) Net mass flow per arm (pair of states) in the KRasG12D diffusion model (Figure 2A). F to N and N to I are not significantly different. The states were ordered in a clock-wise direction, and the net mass flow in the direction was calculated as the difference between forward and backward mass flows, with a positive value indicating net flow in the indicated direction and a negative value the opposite direction; (D) Model for KRasG12D trafficking between the diffusion states and between the membrane system and the environment (cytosol). Arrows indicate the directional mass flow, and the dashed line represents unknown mechanisms connecting the fast and the immobile states. *All error bars are 95% CIs (n = 22).

