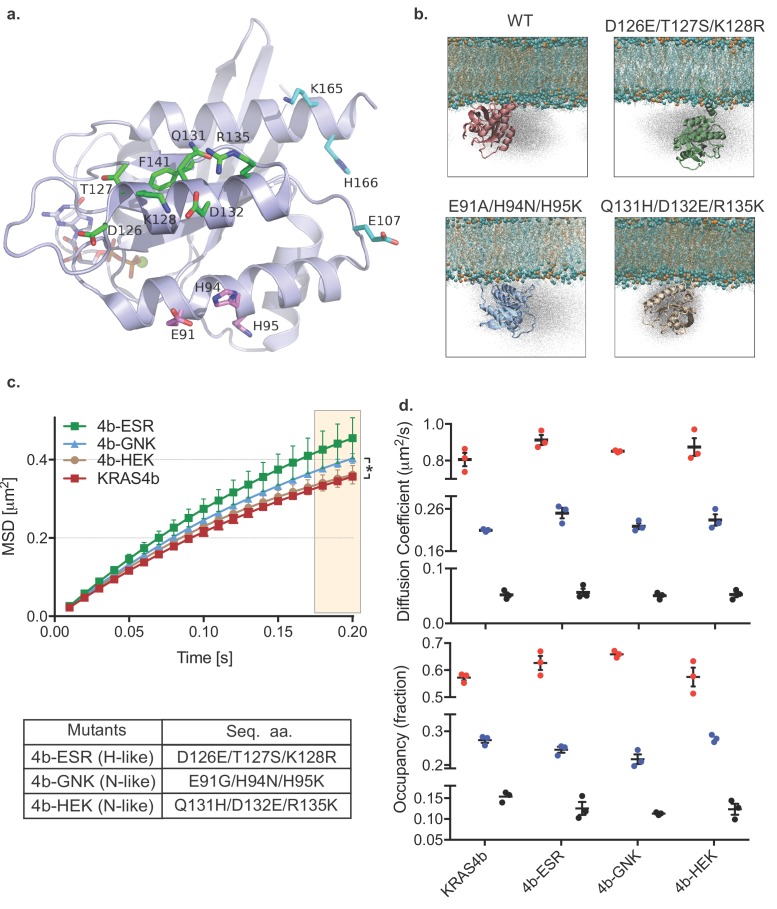
Figure 2. HMM and MSD analysis results of KRAS4b with mutated contact points of G-domain with the lipids and the MD simulation of KRAS4b and the same mutant.
(a) Ribbon diagram of the G-domain of KRAS depicts locations of transitory contact points with the lipids and the following table shows mutations made to the G-domain to mimic H-like or N-like RAS at those key residues. (b) Snapshots from simulations of KRAS4b on lipid membrane (POPC: POPS, 80:20) are shown where G-domain makes transitory contacts with the lipids via salt bridges, with the ghost/shadow representation exhibiting space that G-domain has sampled. (c) MSD plot from the H-like or N-like mutants are relatively less confined compared to WT-KRAS4b (the asterisk * indicates three displacement values under shaded area are significantly different, p<0.05). (d) Diffusion coefficients and occupancy obtained from HMM analysis are compared for each mutant; no significant difference was found between mutants.

