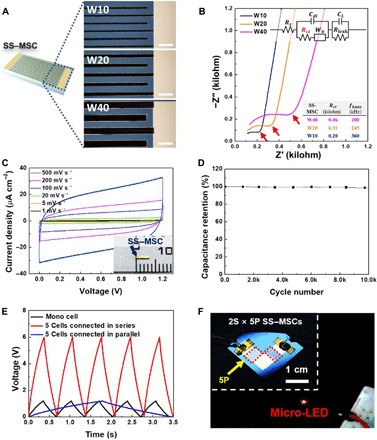
Fig. 4. Electrochemical performance of SS–MSCs.

(A) Optical microscopy images of the printed electrodes with different widths (10, 20, and 40 μm, denoted as W10, W20, and W40, respectively). Scale bars, 50 μm. (B) Nyquist plots of the SS–MSCs with different electrode widths. Inset shows an associated equivalent circuit based on a modified Randles circuit. Red arrows indicate knee frequencies. (C) CV profiles (scan rate, 1 to 500 mV s−1) of the SS–MSC. Inset shows a photograph of the SS–MSC. (D) Capacitance retention (scan rate, 1000 mV s−1) of the SS–MSC as a function of charge/discharge cycle number. (E) Galvanostatic charge-discharge (GCD) profiles of the five SS–MSC unit cells connected in series or in parallel. (F) Photograph of the micro–light emitting diode (LED) powered by 10 SS–MSC unit cells with the combined configuration (2S × 5P) of two cells in series (2S) and five cells in parallel (5P, represented by the red dashed boxes). Photo credit: (F) Kwon-Hyung Lee, Ulsan National Institute of Science and Technology.
