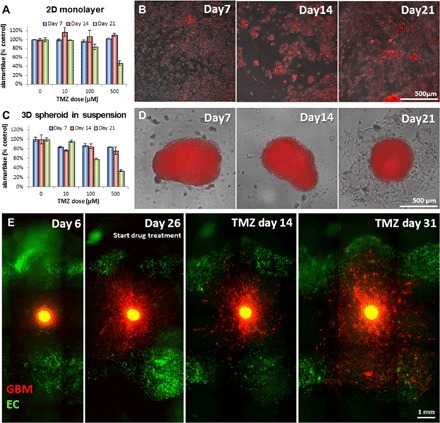
Fig. 2. Drug response of GBM cells cultured in different settings.

Drug response of GBM cells cultured in different settings. (A to D) alamarBlue test results for testing metabolic activities of tumor cells and the overlay of phase contrast and fluorescent images of GBM cells cultured in 2D monolayer (A and B) and 3D suspended spheroid (C and D). (E) Invasive behavior of GBM cells before and after the treatment. SD02 cells from the embedded spheroid aggressively invaded into the surrounding matrix (day 26), regressed, and showed shrinkage of tumor core after drug treatment (14 days after drug treatment). However, some GBM cells survived the treatment and resumed its active invasion even with the continuing treatment (31 days after drug treatment). Top-view images (B, D, and E) were captured using WFFM. EC, endothelial cell.
