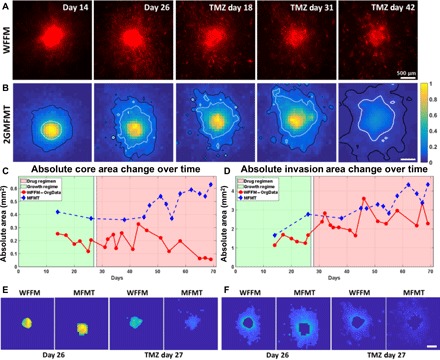
Fig. 4. Longitudinal intensity assessment of GBM brain tumor (tumor ID: 1).

(A) WFFM that depicts the cellular invasion. (B) Epifluorescence equivalent raw data from 2GMFMT shows the diffused intensity signal from tumor cells. The 50% maximum intensity isoline (white) delineates the tumor core area, and the 10% maximum intensity isoline (black) shows the invasion area. Core area (C) and invasion area (D) values are shown for all data points, and representative data points are shown pictorially. In particular, the invasion area followed the same trend across modalities. (E) The segmented core areas from WFFM and MFMT 2D images for initial stage (day 26) and regressed stage (TMZ regimen at day 27). (F) The segmented invasion areas WFFM and MFMT 2D images for initial stage (day 26) and regressed stage (TMZ regimen at day 27). Scale bars, 500 μm.
