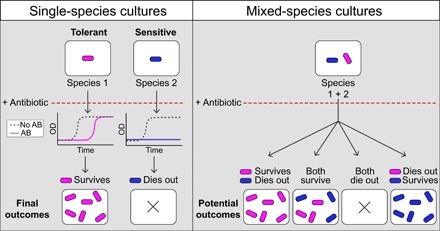
Fig. 1. Scheme illustrating the bacterial response of single-species cultures (left) and mixed-species cultures (right) to a specific antibiotic.

Species 1 (magenta) has a tolerant response to an antibiotic (AB), while species 2 (blue) presents a sensitive response. Both sensitivities can be captured by measuring bacterial growth [optical density (OD)] over time and observing the resulting final outcomes. The mixed-species culture can have one of four different potential outcomes, described in the text.
