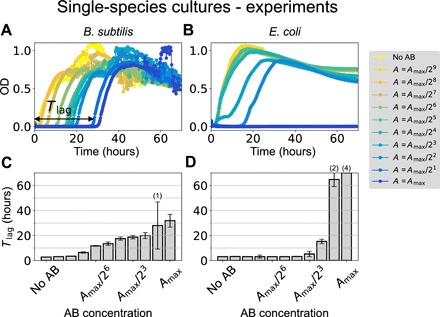
Fig. 2. Single-species responses to ampicillin.

(A and B) Growth curves of B. subtilis (A) and E. coli (B) under increasing concentrations of ampicillin. The maximum antibiotic concentration is Amax = 50 μg/ml in both cases. The horizontal double-headed arrow in (A) shows schematically the meaning of the time lag (Tlag) for the highest antibiotic concentration. (C and D) The corresponding median time lags for (A) and (B), respectively, as a function of the initial antibiotic concentration. Error bars represent SD over four replicates (see also fig. S1). The numbers in parentheses on top of some bars indicate the number of replicates in which growth was not observed within the time window of our experiment (70 hours). For the bar on the far right reaching the maximum of the y axis, none of the four replicates exhibited growth in 70 hours.
