
Fig. 3. Monoculture growth dynamics of the molecular titration model.
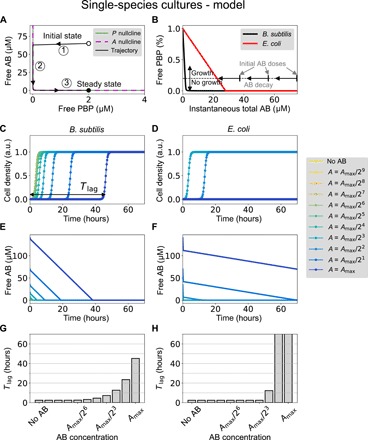
(A) Sample trajectory (black line) in the phase space defined by the two variables P and A. The two nullclines of the system are shown in solid green and dashed magenta lines. Labels 1 to 3 correspond to the three portions of the trajectories indicated in fig. S6. The parameters are k1 = 0.15 (μM · s)−1, k2 = 0.0015 s−1, Pt = 2 μM, At = 65 μM, and γ = 5 × 10⁻⁴ s−1. (B) Free PBP as a function of instantaneous total antibiotic (AB) concentration, under the assumption that AB varies slowly [which happens in portions 2 and 3 of the trajectory shown in (A)]. The parameters for B. subtilis (black line) are the ones given above, while E. coli (red line) is described by two parameter changes: Pt = 28 μM and γ = 6 × 10⁻⁶ s−1. (C and D) Dynamics of the cell density resulting from the logistic equation (Eq. 8) for both species and different antibiotic concentrations. Parameters are those of the previous panels, plus kp = 2 μM, n = 2, μ = 6 × 10⁻⁴ s−1, and μ0 = − μ/10. The maximum antibiotic concentration is Amax = 140 μM, which approximately corresponds to the antibiotic concentration used in the experiments shown in Fig. 2 above. a.u., arbitrary units. (E and F) Corresponding temporal behavior of the free antibiotic. (G and H) Growth time lag (Tlag) as a function of the total antibiotic concentration.