
Fig. 5. Growth dynamics of the molecular titration model for B. subtilis (left column) and E. coli (right column) in the case of a mixed-species community.
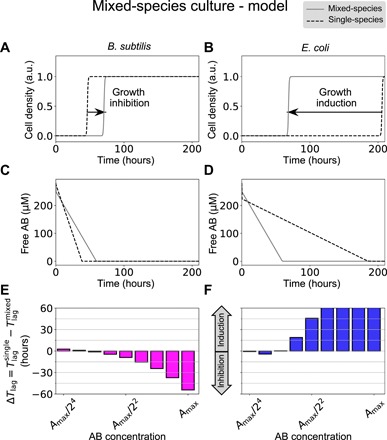
(A and B) Dynamics of the cell density for the two species in mixed cultures (gray solid lines) in comparison with their behavior in isolation (dashed lines) for a total antibiotic concentration of 280 μM. (C and D) Corresponding temporal behavior of the free antibiotic (the single-culture case has been scaled up twofold for comparison). (E and F) Predicted time lag difference between the monoculture and the coculture conditions for the two bacterial species. Parameters are those of Fig. 3, plus ka = 0.2 s−1. The maximum antibiotic concentration is Amax = 280 μM.