
Fig. 6. Experimental observations of mixed-species cultures of B. subtilis and E. coli.
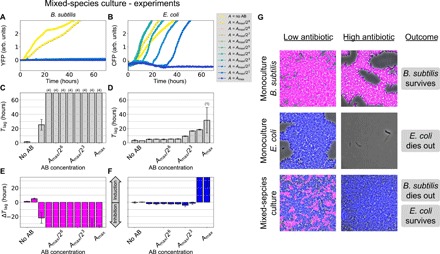
(A and B) Fluorescence marker signal reporting on the growth of the two species: YFP for B. subtilis and CFP for E. coli, respectively. (C and D) Median time lags for (A) and (B), respectively, as a function of the initial antibiotic concentration. Error bars represent SD over four replicates. The numbers in parentheses on top of some bars indicate the number of replicates in which growth was not observed within the time window of our experiment (70 hours). (E and F) Time lag difference between the mixed-species and single-species conditions as a function of the total antibiotic concentration (Amax = 100 μg/ml). (G) Composite phase and fluorescence microscopy images after 48 hours in coculture. B. subtilis cells express YFP (represented here in magenta), and E. coli cells express CFP (represented in blue). The low antibiotic concentration condition (left column) contains media with ampicillin (0.39 μg/ml), and the high antibiotic condition (middle column) contains 25 μg/ml.