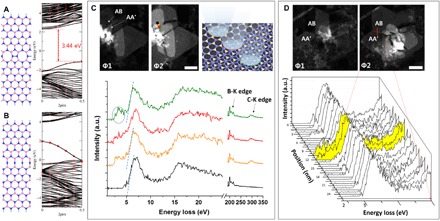
Fig. 4. Bandgap of hBN at twin boundary.

(A and B) The atomic model and corresponding band structure for the 558-N (A) and 6′6′-N (B) configurations, respectively. The red circles in the band structures represent the contribution of N atoms at twin boundary. Boron, nitrogen, and hydrogen atoms are represented by pink, blue, and cyan spheres, respectively. (C) Bandgap measurement at and near the atomically sharp AA′/AB stacking boundary. Four EEL spectra are deconvoluted by the subtraction of ZLP and plural scattering from the original spectra. The black-colored EEL spectrum is from clean hBN, orange- and green-colored EEL spectra are from hBN with hydrocarbon adsorbates on surface, and the red-colored EEL spectrum is from the twin boundary of hBN. The extrapolated lines meet at the x intercept around 5 eV, from the black-, orange-, and green-colored spectrum representing the bandgap of hBN. a.u., arbitrary units. (D) EELS line profile across atomically sharp AA′/AB stacking boundary. Space of each scan is 1.5 nm. Scale bars, 50 nm.
