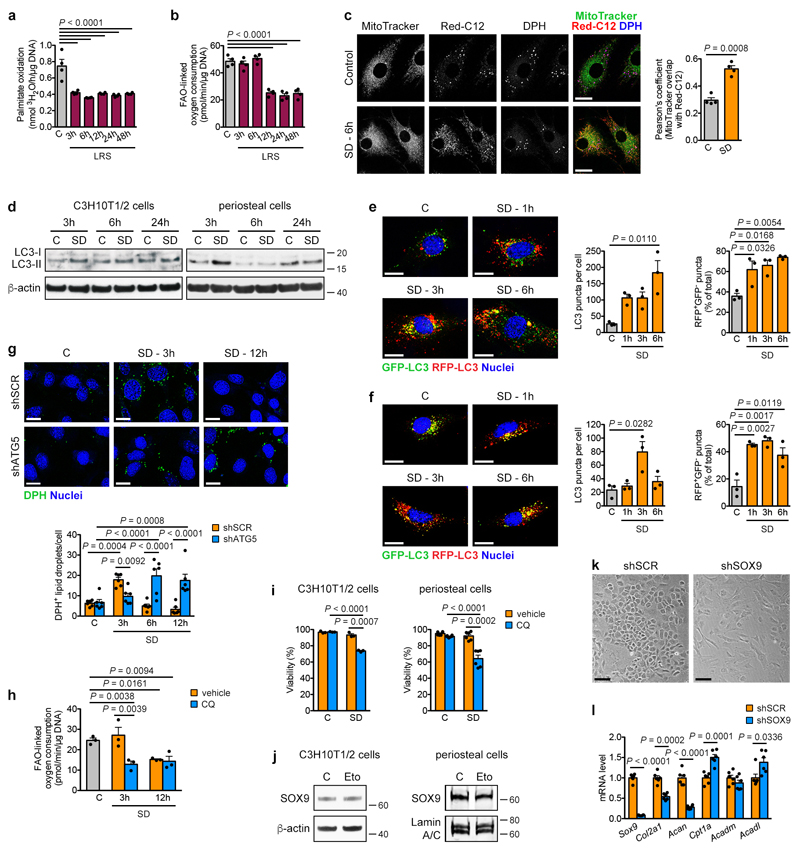
Extended Data Figure 7. Changes in FAO and autophagy after lipid deprivation.
(a) Measurement of oxidation of extracellularly added palmitate by periosteal cells in control medium or at different times in LRS medium (n=4 biologically independent samples). (b) Quantification of FAO-linked OCR in periosteal cells in control medium or at different times in LRS medium (n=4 biologically independent samples). (c) Confocal microscopy of periosteal cells labelled with Red-C12 (fluorescent fatty acid, red) and stained with MitoTracker (mitochondria, green) and DPH (lipid droplets, blue) shows increased co-localization (as quantified by Pearson’s correlation coefficient) of MitoTracker and Red-C12 after exposure of cells for 6 hours to SD (n=4 biologically independent samples). Scale bars, 20μm. (d) Immunoblot detection of LC3 in total cell protein extracts of C3H10T1/2 cells and periosteal cells exposed for different times to control or SD medium, with β-actin as loading control. Note increased conversion of LC3-I to LC3-II at early time points, indicative of activation of autophagy (n=2 independent experiments). (e,f) Confocal microscopy of C3H10T1/2 cells (e; n=3 independent experiments) or periosteal cells (f; n=3 biologically independent samples), expressing an RFP-GFP-LC3 tandem construct, shows activation of autophagy with time upon SD, evidenced by increased total number of LC3 puncta per cell and higher percentage of RFP+GFP- puncta. Scale bars, 20μm. (g) Confocal microscopy-based visualization (top) and quantification (bottom) of C3H10T1/2 cells, stained with the neutral lipid dye DPH to reveal lipid droplet dynamics at different time points after SD. Cells were transduced with shATG5 to inhibit autophagy or shSCR as a control (n=6 independent experiments). Scale bars, 20μm. (h) Quantification of FAO-linked OCR in periosteal cells in control medium or at different times after SD, treated with 10μM chloroquine (CQ) or vehicle (n=3 biologically independent samples). (i) Quantification of cell viability of C3H10T1/2 cells and periosteal cells after 72 hours of exposure to control or SD medium in the presence or absence of 50μM (C3H10T1/2 cells) or 10μM (periosteal cells) CQ (n=3 independent experiments for C3H10T1/2 cells, n=3 biologically independent samples for periosteal cells). (j) Immunoblot detection of total SOX9 in C3H10T1/2 cells and nuclear SOX9 in periosteal cells exposed for 6 hours (C3H10T1/2 cells) or 24 hours (periosteal cells) to control medium (with DMSO as vehicle control) or medium supplemented with 100μM etomoxir (Eto), with β-actin or Lamin A/C as loading control. (k) Cell morphology of growth plate-derived chondrocytes transduced with shSOX9 or shSCR (representative images of 6 biologically independent samples). Scale bar, 100μM. (l) qRT-PCR analysis of genes involved in chondrogenesis (Sox9, Col2a1 and Acan) and FAO (Cpt1a, Acadm and Acadl) in growth plate-derived chondrocytes transduced with shSOX9 or shSCR (relative to shSCR, n=6 biologically independent samples). Mean ± s.e.m. One-way ANOVA (a,b,e,f) or two-way ANOVA (g,h,i) with Bonferroni post-hoc test, two-tailed Student’s t-test (c,l). For gel source data, see Supplementary Figure 1.

