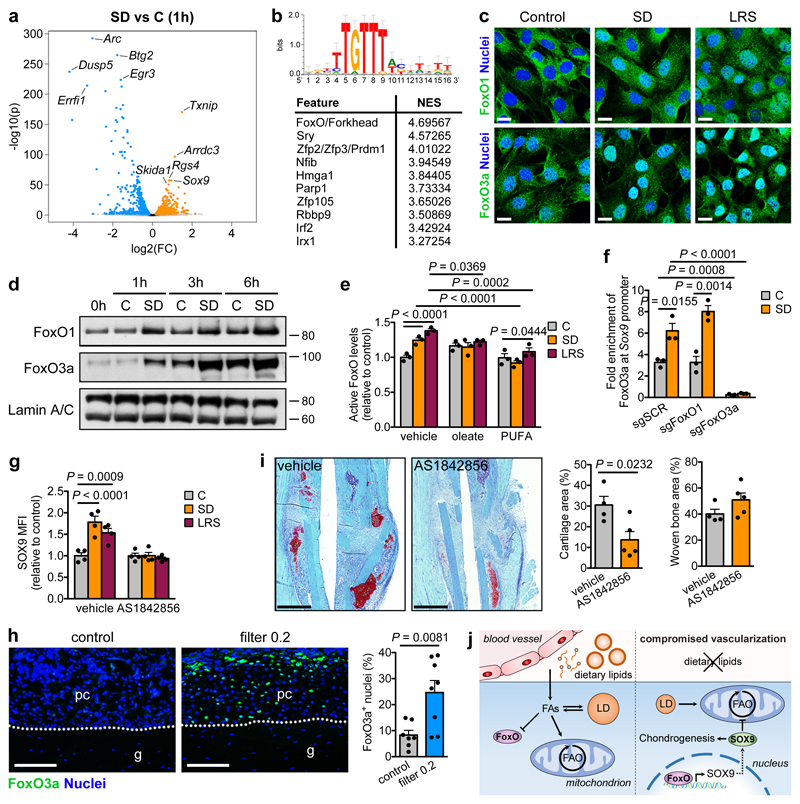
Figure 4. Lipids regulate SOX9 through FoxO signalling.
(a,b) Volcano plot showing significantly enriched and depleted mRNAs (a) and top 10 most significantly enriched transcription factor motifs with normalized enrichment scores (NES) as determined by i-cisTarget analysis (b) in C3H10T1/2 cells exposed for 1 hour to SD versus control medium (n=3 replicates). Motif shown on top is the Forkhead/FoxO motif. (c) Confocal microscopy of C3H10T1/2 cells stained for FoxO1 (top) or FoxO3a (bottom) shows increased nuclear localization after exposure of cells for 3 hours to SD or LRS (representative images of 2 independent experiments). Scale bars, 20μm. (d) Immunoblot detection of nuclear FoxO1 and FoxO3a in C3H10T1/2 cells exposed for 1, 3 or 6 hours to control or SD medium, with Lamin A/C as loading control (n=2 independent experiments). (e) Nuclear FoxO activity in C3H10T1/2 cells exposed for 3 hours to control, SD or LRS medium supplemented with vehicle (EtOH), oleate (60μM) or poly-unsaturated fatty acids (PUFA) (n=3 independent experiments). (f) Occupancy of FoxO3a at the Sox9 promoter of Cas9-expressing C3H10T1/2 cells transduced with inducible short guidance RNA against FoxO1 (sgFoxO1), sgFoxO3a or a scrambled sgRNA (sgSCR), exposed for 3 hours to control or SD medium in the presence of doxycycline (250ng/ml), as determined by ChIP-qPCR (n=3 independent experiments). (g) Flow cytometric quantification of total SOX9 levels in periosteal cells exposed for 24 hours to control, SD or LRS medium supplemented with 1μM AS1842856 (FoxO inhibitor) or vehicle (DMSO) (n=4 biologically independent samples). (h) Histological visualization and quantification of FoxO3a-expressing cells in the central periosteal callus of grafts with or without a filter (0.2μm pore size) at PFD7 (control: n=7, filter 0.2: n=8 mice). Scale bars, 50μm. (i) Histological visualization (Safranin O staining) and quantification of cartilage and woven bone in the callus at PFD7 of mice treated daily with AS1842856 (500pmol) or vehicle (0.1% DMSO in saline) at the fracture site (vehicle: n=4, AS1842856: n=5 mice). Scale bars, 500μm. (j) Schematic overview of main findings. Mean ± s.e.m. Two-way ANOVA with Bonferroni post-hoc test (e-g), two-tailed Student’s t-test (h,i). For gel source data, see Supplementary Figure 1.

