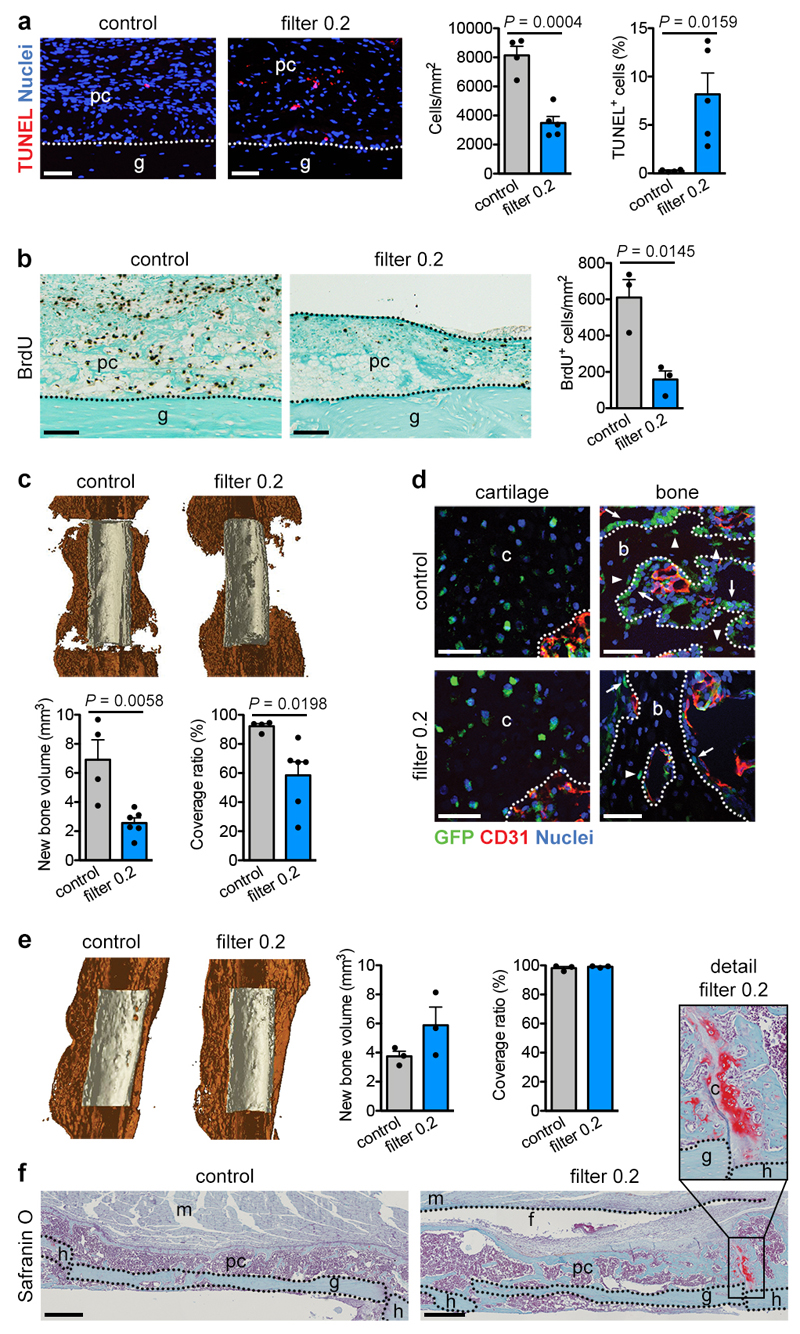
Extended Data Figure 2. Reducing vascularization alters but does not prevent bone healing.
(a) Histological visualization and quantification of apoptotic cells (TUNEL+; n=4 mice for control, n=5 mice for filter 0.2) in the callus of grafts with or without a filter (0.2μm pore size) at PFD7. Scale bars, 50μm. (b) Histological visualization and quantification of proliferating (BrdU+; n=3 mice) cells in the callus of grafts with or without a filter (0.2μm pore size) at PFD7. Scale bars, 100μm. (c) MicroCT-based visualization and quantification of newly formed bone around control grafts or grafts surrounded by a filter (0.2μm pore size) at PFD14 (n=4 mice for control, n=6 mice for filter 0.2). Coverage ratio represents percentage of graft surface covered by new bone. (d) Cell tracing of donor periosteal cells during healing of bone grafts, derived from CAG-EGFP mice, with or without filter (0.2μm pore size) at PFD14 showing equal contribution of donor cells to cartilage in both conditions, but reduced contribution of donor cells to bone near the graft ends (arrows: GFP+ osteoblasts, arrowheads: GFP+ osteocytes, representative images of 3 mice). Scale bars, 50μm. (e) MicroCT-based visualization and quantification of newly formed bone around control grafts or grafts surrounded by a filter (0.2μm pore size) at PFD28 (n=3 mice). (f) Histological analysis of autografts with or without a filter (0.2μm pore size) at PFD28 showing comparable callus morphology and composition, although remaining cartilage islands (detail image) were seen when a filter was present but not in the callus of control grafts (representative images of 3 mice). Scale bars, 500μm. b: bone, c: cartilage, f: filter, g: graft, h: host, m: muscle, pc: periosteal callus. Mean ± s.e.m. Two-tailed Student’s t-test.

