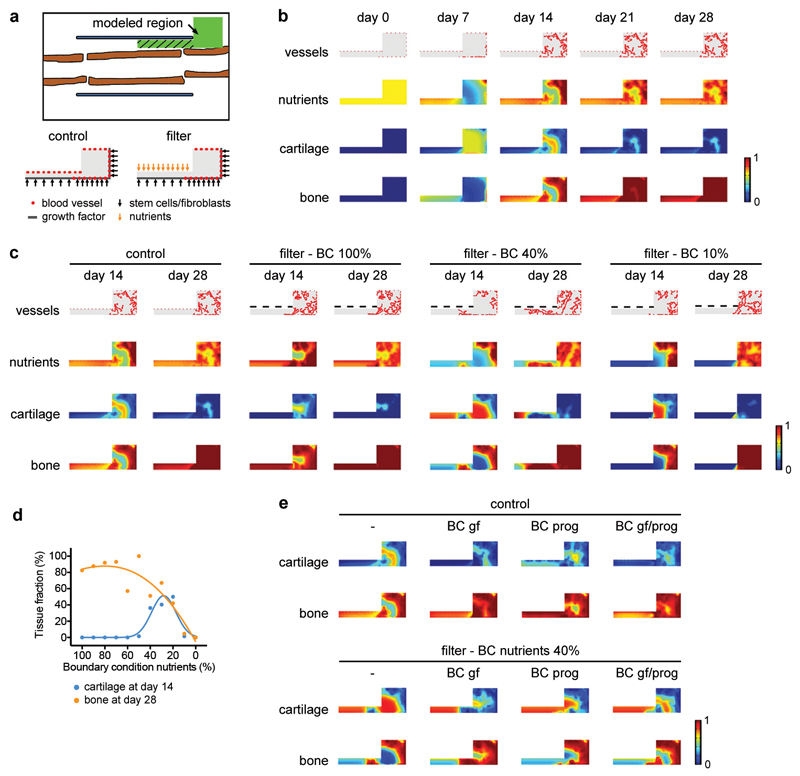
Extended Data Figure 3. In silico modelling supports a role for nutritional stress in chondrogenic commitment.
Application of a previously described computational model of bone repair10,11 to the bone graft healing setup. In this model the behaviour (survival, proliferation, differentiation and tissue formation) of skeletal progenitor cells, chondrocytes, osteoblasts and fibroblasts is dependent on the local supply of nutrients by blood vessels, in addition to the presence of growth factors, extracellular matrix and the cell density. (a) Schematic overview (top) of the modelled region shown in green. The hatched area represents the graft callus. At the start of the simulation the modelled region was filled with loose fibrous tissue matrix, growth factors, stem cells, osteoblasts, fibroblasts and nutrients, representing the fracture haematoma. Overview of the Dirichlet boundary conditions (bottom) showing the starting points of blood vessels and the sites of release of cells and growth factors (and nutrients for the condition with filter) during the healing process. (b) Application of the model to the normal bone graft (i.e. blood vessels can come from the muscle side). Heat map-based visualization of blood vessel, nutrient, cartilage and bone distribution in the modelled region at different time points shows that the model correctly predicts the spatiotemporal progression of the bone healing process. Nutrients and tissue fractions are expressed on a non-dimensional scale ranging from 0 (absence) to 1 (saturation). (c,d) Application of the model to bone graft healing in the presence of a filter placed in between graft and muscle (i.e. blood vessels cannot come from the muscle side) with visual representation (c) and quantification (d) of the different tissue fractions in the modelled region. Quantification was performed only in the left rectangle of the modelled region, as indicated by the hatched area in panel a, representing the graft callus. The amount of nutrients that can pass through the filter (boundary condition; BC) was varied between 100% (= the maximal amount that can be supplied by the vasculature, applied to the whole filter length, resulting in similar nutrient distributions as in the control) and 0%. When nutrient supply through the filter is set at 20-40%, the model correctly recapitulates the chondrogenic switch in the central region of the graft as observed in vivo. When nutrient supply through the filter was >40%, the cells in the central graft region differentiated directly into osteoblasts, while a supply of nutrients <20% induced massive cell death and completely prevented tissue formation and graft healing. (e) Visual representation of the effect of additional growth factor (gf) diffusion and/or progenitor cell (prog) migration from the filter side on cartilage and bone fractions at day 14. The control situation (no filter) is shown on the left and the filter situation with a BC for nutrients of 40% is shown on the right. No large effect of these additional BC on the healing response was observed.

