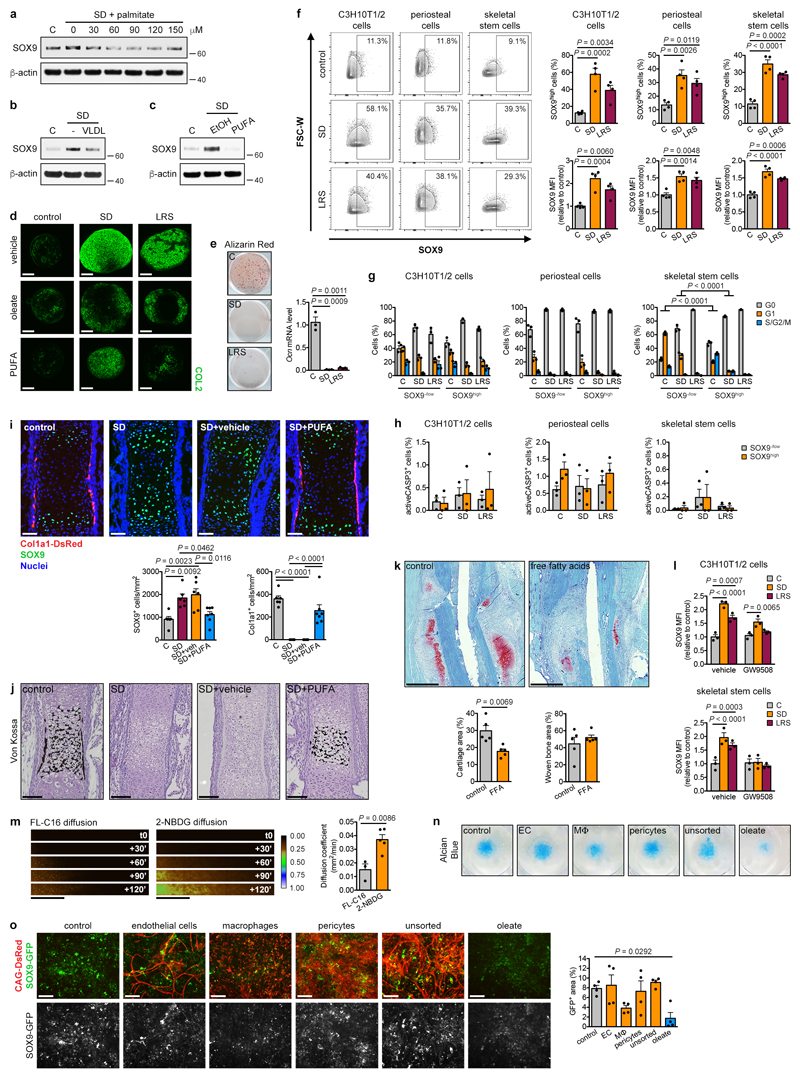
Extended Data Figure 5. Reduced lipid availability favours chondrogenesis over osteogenesis.
(a-c) Immunoblot detection of total SOX9 in C3H10T1/2 cells exposed for 6 hours to control medium, SD medium or SD medium supplemented with increasing concentrations of palmitate (a), with VLDL (b), or with PUFA (c). Detection of β-actin was used as loading control. EtOH was used as a vehicle control in a and c (n=2 independent experiments). (d) Histological visualization (by immunofluorescence for COL2) of chondrogenic differentiation of periosteal cells in pellet cultures in control, SD medium or LRS medium supplemented with vehicle (EtOH), oleate or PUFA (representative images of n=2 independent experiments). Scale bars, 100μm. (e) Osteogenic differentiation of periosteal cells in control, SD medium or LRS medium, assessed by visualization of mineral deposits (Alizarin Red staining) and quantification of Ocn mRNA levels (relative to Actin, n=3 biologically independent samples). (f) Flow cytometric detection and quantification of the percentage of SOX9high cells and total SOX9 levels in C3H10T1/2 cells, periosteal cells and skeletal stem cells exposed for 24 hours to control, SD or LRS medium (n=4 independent experiments for C3H10T1/2 cells, n=4 biologically independent samples for periosteal cells, skeletal stem cells). Gating for SOX9high cells was set to have approximately 10% SOX9high cells in control conditions in each cell type. (g,h) Flow cytometric quantification of cell cycle (g) and apoptosis (h) in SOX9low and SOX9high subpopulations of C3H10T1/2 cells, periosteal cells and skeletal stem cells exposed for 24 hours to control, SD or LRS medium (n=3 independent experiments for C3H10T1/2 cells, n=3 biologically independent samples for periosteal cells, skeletal stem cells). (i) Histological visualization and quantification of early chondrogenic (SOX9+) and osteogenic (Col1a1-DsRed+) cells in metatarsals cultured for 1 week in control medium, SD medium, or SD medium supplemented with PUFA or vehicle (EtOH) (n=6 biologically independent samples for control, SD and SD+veh, n=7 biologically independent samples for SD+PUFA). Scale bars, 50μm. (j) Histological visualization of mineralization by Von Kossa staining in metatarsals cultured for 1 week in control medium, SD medium, or SD medium supplemented with vehicle or PUFA (representative images of n=6 biologically independent samples for control, SD and SD+veh, n=7 biologically independent samples for SD+PUFA). Scale bars, 100μm. (k) Histological visualization (Safranin O staining) and quantification of cartilage and woven bone in the callus at post-fracture day 7 of mice treated daily with free fatty acids (FFA; 20μl corn oil) or sham injection (saline) at the fracture site (n=5 mice). Scale bars, 500μm. (l) Flow cytometric quantification of total SOX9 levels in C3H10T1/2 cells or skeletal stem cells exposed for 24 hours to control, SD or LRS medium supplemented with 100μM GW9508 or vehicle (DMSO) (n=3 independent experiments for C3H10T1/2 cells, n=3 biologically independent samples for skeletal stem cells). (m) Visualization and quantification of diffusion of a fluorescent fatty acid (FL-C16) and fluorescent glucose (2-NBDG) in collagen gels seeded with periosteal cells (5 million/ml) (n=3 biologically independent samples for FL-C16, n=5 biologically independent samples for 2-NBDG). Scale bars, 500μm. (n,o) Visualization of Alcian Blue staining (n) and visualization and quantification of Sox9 expression (o) in micromass co-cultures of periosteal cells from Sox9-GFP mice and sorted cell populations from skeletal muscle of CAG-DsRed mice, after 9 days in chondrogenic SD medium (n=4 biologically independent samples). Addition of oleate was used as positive control. Scale bars, 100μm. EC: endothelial cell, MΦ: macrophage. Mean ± s.e.m. One-way ANOVA (e,f,i,o), two-way ANOVA (h,l) or three-way ANOVA (g) with Bonferroni post-hoc test, two-tailed Student’s t-test (k,m). For gel source data, see Supplementary Figure 1.

