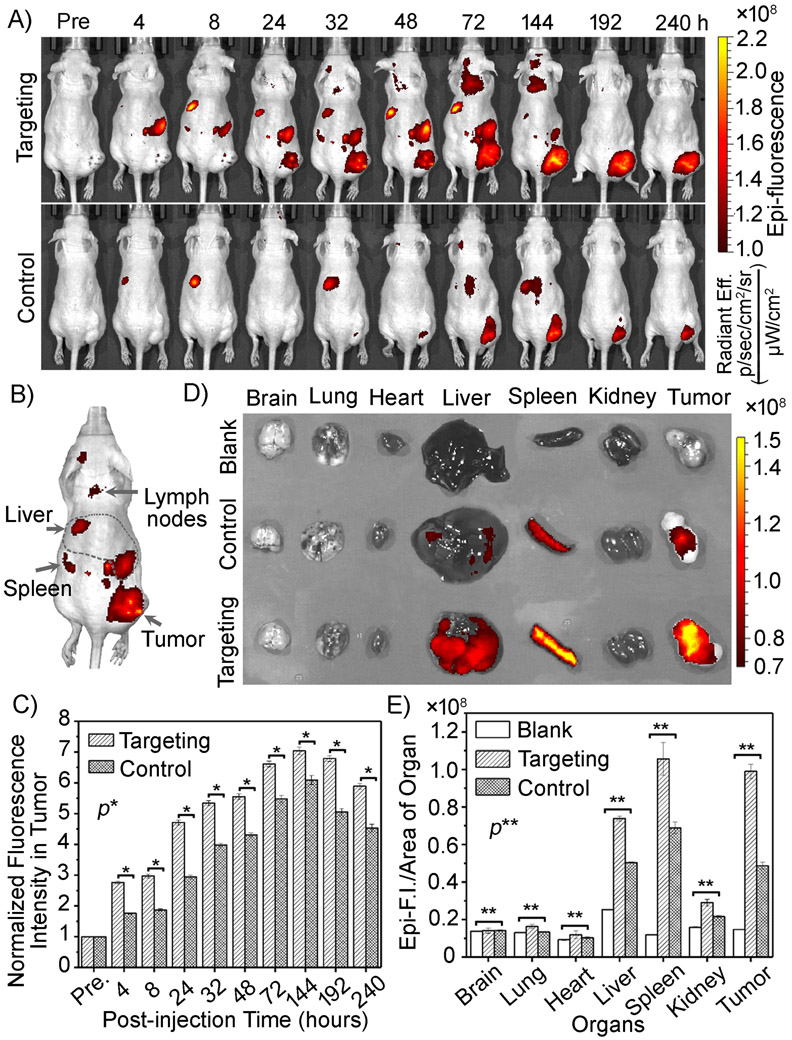
Figure 5.
In vivo near-infrared fluorescence (NIRF) imaging. (A) NIRF images of subcutaneous PC-3 (α2β1 positive) prostate tumors in athymic nude mice (n = 6) before and 4–240 h after the intravenous injection of Gd-Cy5.5-PhMV-DGEA (targeted group) or Gd-Cy5.5-PhMV-mPEG (control group). (B) Visualization of the main organs in vivo. (C) Quantitative analysis of fluorescence intensity in tumors (p < 0.01). (D) Ex vivo NIRF images of main organs (brain, lung, heart, liver, spleen, kidneys, and tumor) after bimodal scanning (240 h postinjection) and (E) quantitative analysis of fluorescence intensity in each organ based on ex vivo NIRF imaging (p < 0.01 in the tumor). Noninjected mice were used as the blank control group.

