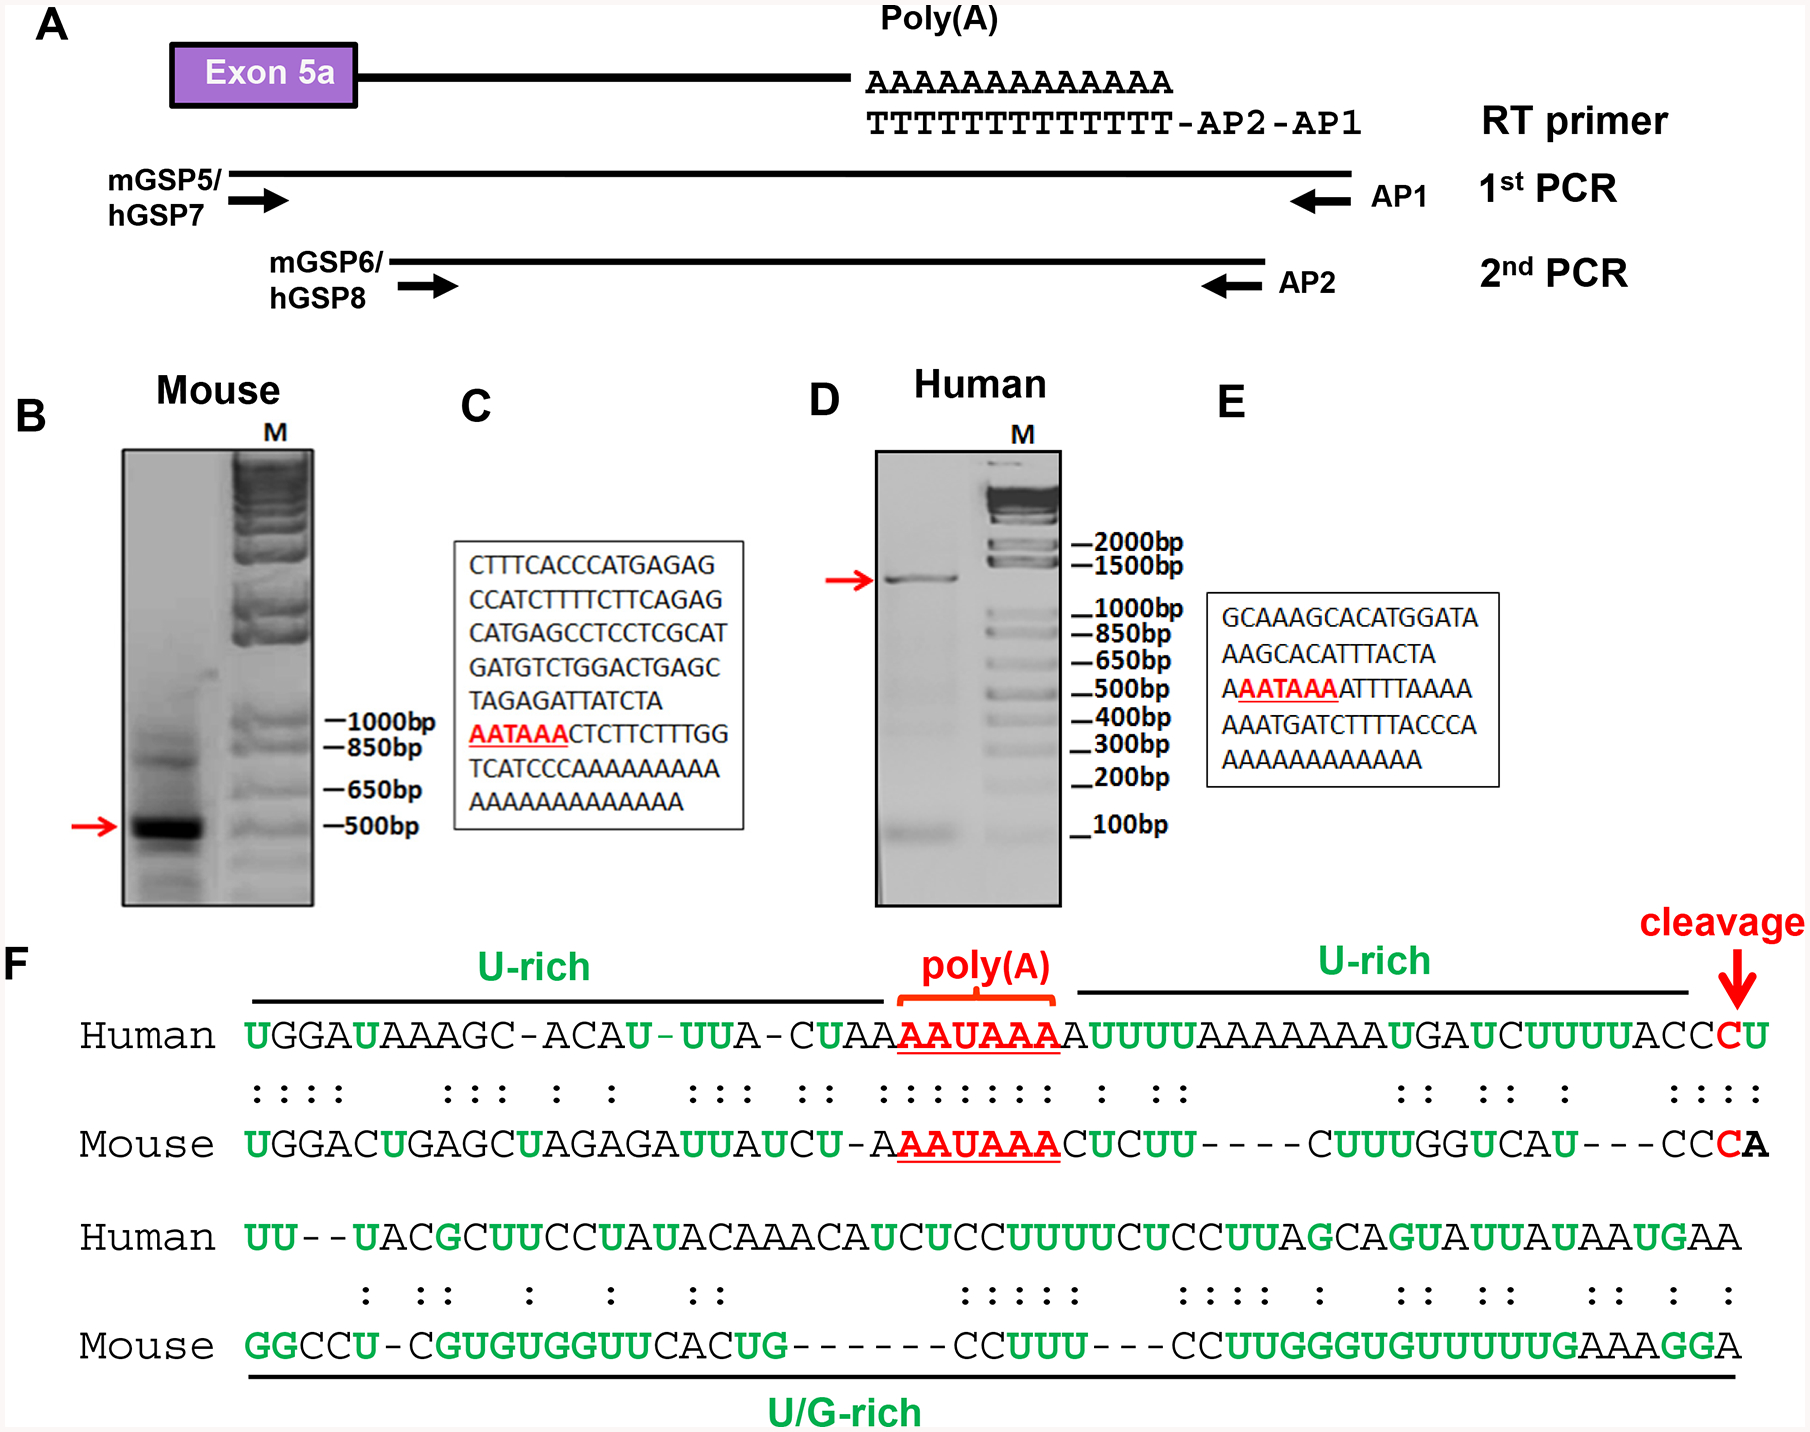
Fig. 2.

Identification of the poly(A) signal sequences of hMOR-1Bs and mMOR-1Bs. A. Schematic of the 3’-RACE strategy. The 3’-RACE was performed as described in Materials and Methods. Primers used for RT, 1st and 2nd PCRs are indicated.
B & D. Analysis of the 2nd PCR products. The 2nd PCR product of the mouse (B) or the human 3’-RACE (D) were separated on 1.5% agarose gel and stained with ethidium bromide. The gel was imaged with ChemiDoc MP system.
C & E. Partial cDNA sequences of the 2nd PCR fragments purified from mouse (B) or human (D). Poly(A) sequences are indicated by underlined red bold letters. M: 1 kb plus DNA marker.
F. Alignment of the poly(A) signal and adjacent sequences of the mouse and human MOR-1Bs. The poly(A) sequences and cleavage sites are indicated by red letter and U-rich or U/G-rich sequences and region shown by green letter and black line, respectively.
