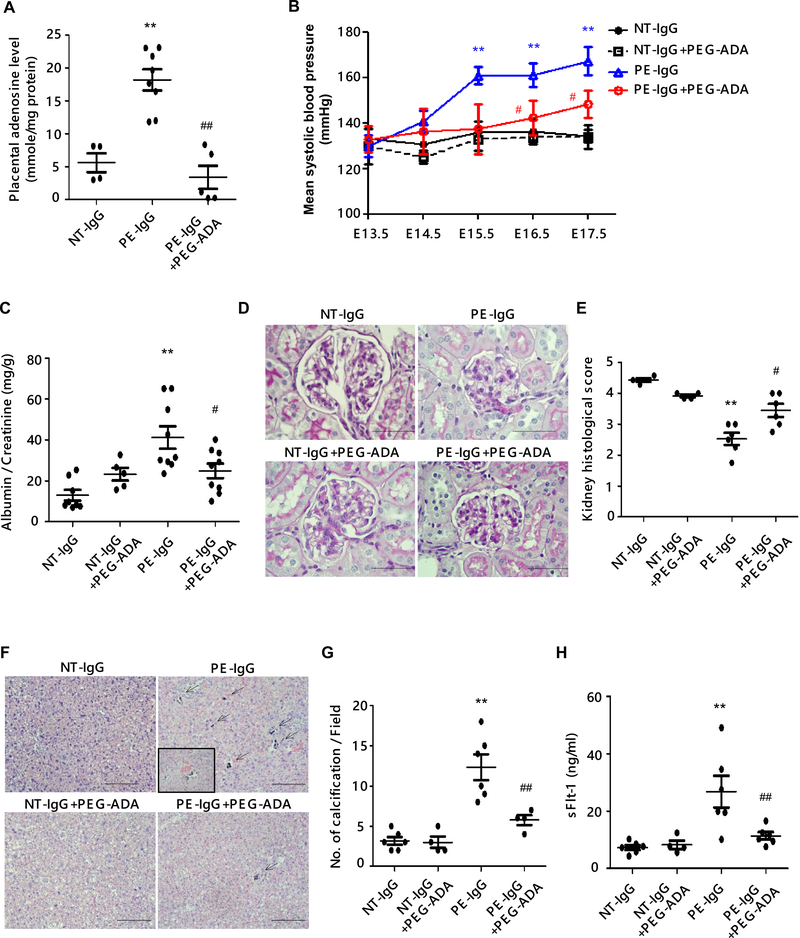
Figure 1. Suppression of placental adenosine levels by the treatment of PEG-ADA ameliorates the preeclamptic features in pregnant mice induced by AT1-AA.
Pregnant mice were injected with purified IgG from normotensive pregnant women (NT-IgG) or PE patients (PE-IgG) on E13.5 and E14.5. PEG-ADA (5 units per mouse) was co-injected with PE-IgG on E13.5. Samples were collected on E18.5.
(A) Levels of adenosine in mouse placentas were measured by HPLC. (NT-IgG: n=4, PE-IgG: n=8, PE-IgG+PEG-ADA: n=5, **P<0.01 vs NT-IgG, ##P<0.01 vs PE-IgG)
(B) Blood pressure was measured by tail-cuff plethysmography on a daily base. (n=5–8 mice per group, **P<0.01 vs NT-IgG, #P<0.05 vs PE-IgG at the same time point)
(C) Proteinuria was determined as urine albumin to creatinine ratio by ELISA. (n=5–8 mice per group, **P<0.01 vs NT-IgG, #P<0.05 vs PE-IgG)
(D) Renal histology assessed by PAS staining. Pathologic changes in kidneys of PE-IgG-treated WT mice (swollen glomeruli with narrowed capillary and Bowman’s spaces) were suppressed by PEG-ADA. Scale bar, 100μm.
(E) Histological changes were quantified as the highest score of 5 accorded to a normal glomerulus to the lowest score of 1 assigned to the glomerulus that showed complete loss of capillary space. (n=4–6 mice per group, **P<0.01 vs NT-IgG, #P<0.05 vs PE-IgG)
(F) Placental histology assessed by H&E staining. Placental damage in the labyrinth zone of PE-IgG-treated WT mice (calcification; arrows, the disorganization of tissue resulting in abnormal blood pooling; inset box) was reduced by treatment with PEG-ADA. Scale bar, 100 μm.
(G) The number of calcifications obtained per field under X10 magnification is quantified. (n=4–6 per group, **P<0.01 vs NT-IgG, ##P<0.01 vs PE-IgG)
(H) The level of circulating sFlt-1 in mouse plasma was determined by ELISA. (n=4–6 mice per group, **P<0.01 vs NT-IgG, ##P<0.01 vs PE-IgG)

