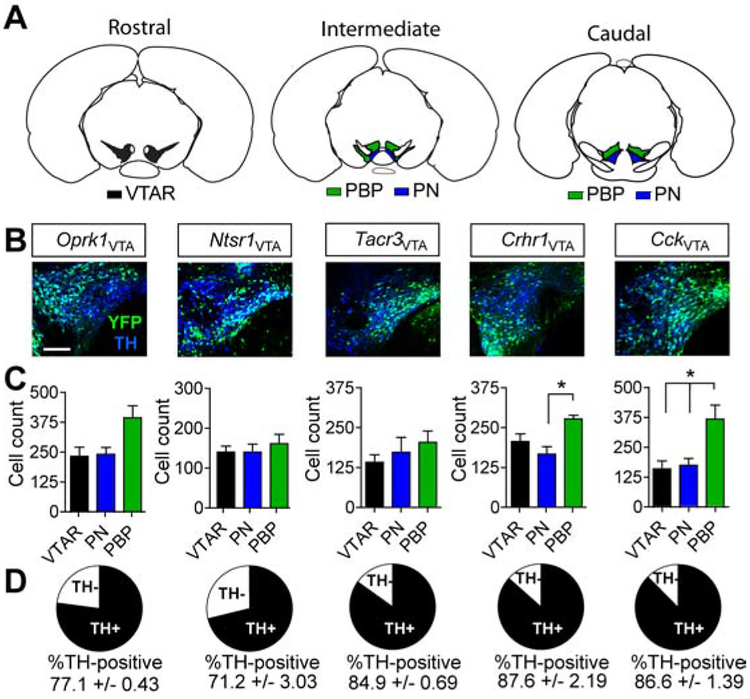
Figure 1. Genetic isolation of VTA sub-populations.
(A) Reference atlas images illustrating VTA subregions: rostral VTA (VTAR) – black; parabrachial pigmented nucleus (PBP) – green; paranigral nucleus (PN) – blue. (B) Example images of VTA sections co-stained for YFP (identifying VTA subpopulations after injection with AAV1-FLEX-YFP) and tyrosine hydroxylase (TH). Scale = 100μm. (C) Cell count quantification by VTA subregion (n=3 mice, 9 sections/animal; one-way ANOVA Crhr1: F(2,8)=7.325, P<0.05; Cck: F(2,8)=7.56, P<0.05, Tukey’s multiple comparisons *P < .05). (D) Proportional overlap between YFP and TH. Data represented as mean +/− S.E.M.

