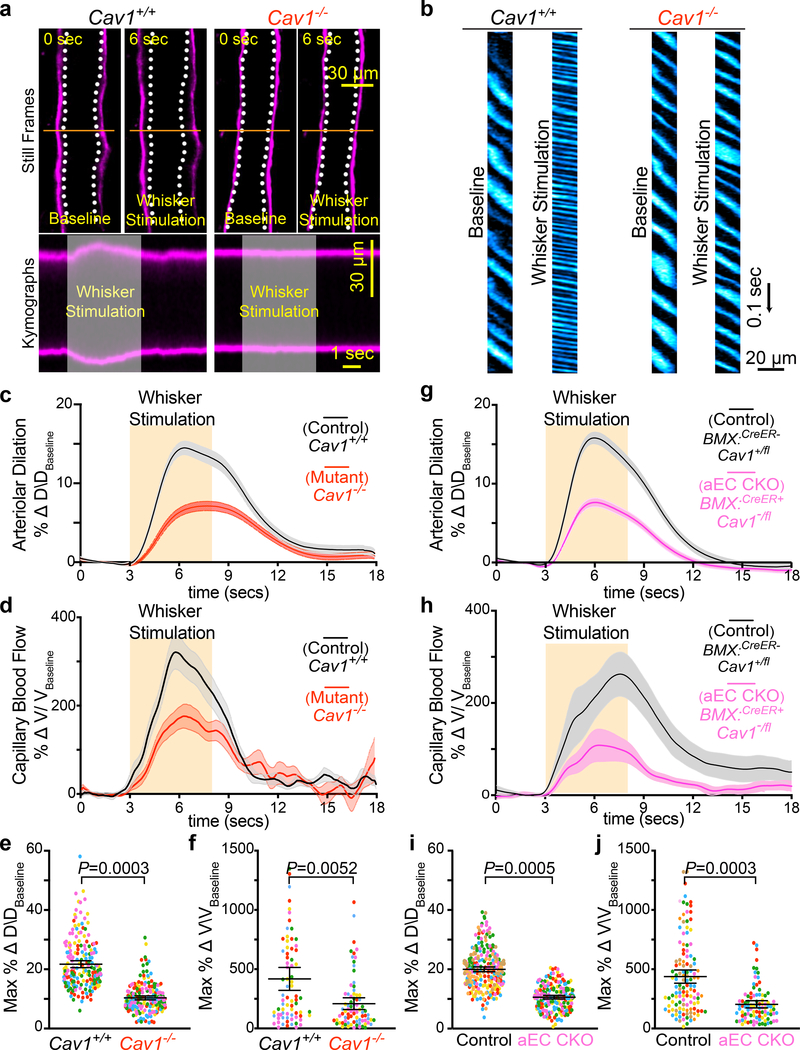
Fig 2. Caveolae in CNS aECs specifically are required for neurovascular coupling.
a, Still frame images of pial arteries during neurovascular coupling in Cav1+/+ and Cav −/− mice using in vivo two-photon microscopy. Top images show Hydrazide-stained arterioles during baseline and whisker stimulation. White hashes outline the arterioles during baseline period. Bottom images show the kymographs of the arteriolar dilation, which were generated by transverse line scans (orange lines in top images). The gray rectangle in the kymograph represents the whisker stimulation period. b, Kymographs of RBC flow in capillaries for Cav1+/+ and Cav1−/− mice. Dark streaks represent red blood cells, blue streaks represent the fluorescent tracer-filled capillary lumen. Left and right kymographs show RBC flow during baseline and whisker stimulation, respectively. Independent replications for (a) and (b) are listed in (c) and (d) respectively. c,d,e,f, Time-course of change in arteriolar dilation (c), change in red blood cell velocity (d), max % change in arteriolar dilation (e) and red blood cell velocity (f) in in Cav1+/+ (n= 5 mice, 196 arterioles, 77 capillaries) and Cav1−/− mice (n=5 mice, 194 arterioles, 79 capillaries). g,h,i,j, Time-course of change in arteriolar dilation (g), change in red blood cell velocity (h), max % change in arteriolar dilation (i) and red blood cell velocity (j) in control (BMX:CreER−;Cav1+/fl; n= 7 mice, 260 arterioles, 122 capillaries) and aEC conditional Cav1 knockout mice (BMX:CreER+;Cav1−/fl; n= 5 mice, 193 arterioles, 94 capillaries). Statistical significance was determined by nested, unpaired, two-tailed t-test for for (e,f,i,j). Data are shown as mean ± s.e.m.

